
|
Hasbro, Inc. (HAS) DCF Valuation |
Fully Editable: Tailor To Your Needs In Excel Or Sheets
Professional Design: Trusted, Industry-Standard Templates
Investor-Approved Valuation Models
MAC/PC Compatible, Fully Unlocked
No Expertise Is Needed; Easy To Follow
Hasbro, Inc. (HAS) Bundle
Looking to assess the intrinsic value of Hasbro, Inc.? Our (HAS) DCF Calculator integrates real-time data with extensive customization options, allowing you to refine your projections and enhance your investment decisions.
What You Will Get
- Real HAS Financials: Includes historical and forecasted data for precise valuation.
- Adjustable Inputs: Modify WACC, tax rates, revenue growth, and capital expenditures.
- Automatic Calculations: Intrinsic value and NPV are calculated dynamically.
- Scenario Analysis: Test multiple scenarios to evaluate Hasbro’s future performance.
- Clear and Intuitive Design: Built for professionals yet accessible for beginners.
Key Features
- Customizable Revenue Projections: Adjust essential metrics such as toy sales growth, licensing revenue, and marketing expenses.
- Instant DCF Valuation: Quickly computes intrinsic value, net present value (NPV), and various financial metrics.
- High-Precision Analysis: Leverages Hasbro's actual financial data for accurate valuation results.
- Effortless Scenario Testing: Evaluate different market conditions and assess their impact on financial outcomes.
- Efficiency Booster: Avoid the hassle of creating intricate valuation models from the ground up.
How It Works
- Download the Template: Gain immediate access to the Excel-based HAS DCF Calculator.
- Input Your Assumptions: Modify the yellow-highlighted cells for growth rates, WACC, profit margins, and more.
- Instant Calculations: The model automatically recalculates Hasbro's intrinsic value.
- Test Scenarios: Experiment with various assumptions to assess potential valuation fluctuations.
- Analyze and Decide: Utilize the findings to inform your investment or financial strategy.
Why Choose This Calculator?
- Accurate Data: Real Hasbro financials ensure reliable valuation results.
- Customizable: Adjust key parameters like growth rates, WACC, and tax rates to match your projections.
- Time-Saving: Pre-built calculations eliminate the need to start from scratch.
- Professional-Grade Tool: Designed for investors, analysts, and consultants.
- User-Friendly: Intuitive layout and step-by-step instructions make it easy for all users.
Who Should Use This Product?
- Investors: Evaluate Hasbro’s valuation prior to buying or selling stocks.
- CFOs and Financial Analysts: Optimize valuation processes and assess financial projections.
- Startup Founders: Understand how leading public companies like Hasbro are valued.
- Consultants: Provide expert valuation reports for clients in the entertainment and toy sectors.
- Students and Educators: Utilize real-world data to practice and teach valuation methodologies.
What the Template Contains
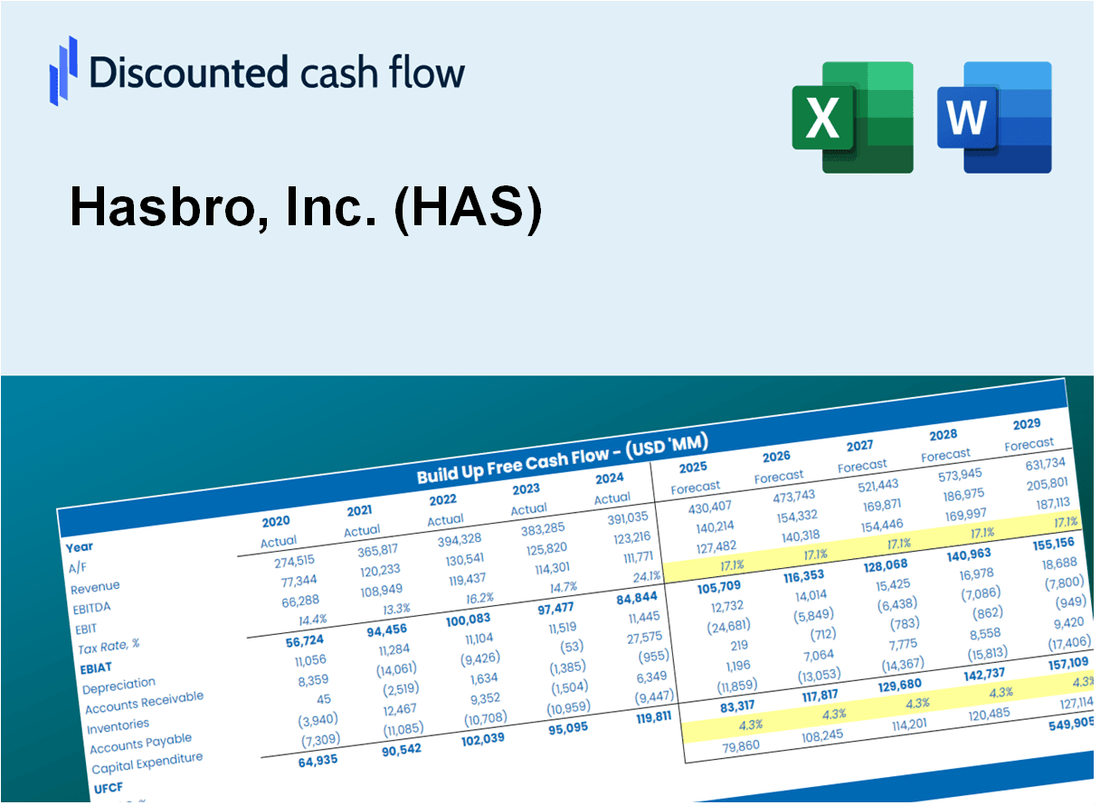
- Operating and Balance Sheet Data: Pre-filled Hasbro historical data and forecasts, including revenue, EBITDA, EBIT, and capital expenditures.
- WACC Calculation: A dedicated sheet for Weighted Average Cost of Capital (WACC), including parameters like Beta, risk-free rate, and share price.
- DCF Valuation (Unlevered and Levered): Editable Discounted Cash Flow models showing intrinsic value with detailed calculations.
- Financial Statements: Pre-loaded financial statements (annual and quarterly) to support analysis.
- Key Ratios: Includes profitability, leverage, and efficiency ratios for Hasbro, Inc. (HAS).
- Dashboard and Charts: Visual summary of valuation outputs and assumptions to analyze results easily.
Disclaimer
All information, articles, and product details provided on this website are for general informational and educational purposes only. We do not claim any ownership over, nor do we intend to infringe upon, any trademarks, copyrights, logos, brand names, or other intellectual property mentioned or depicted on this site. Such intellectual property remains the property of its respective owners, and any references here are made solely for identification or informational purposes, without implying any affiliation, endorsement, or partnership.
We make no representations or warranties, express or implied, regarding the accuracy, completeness, or suitability of any content or products presented. Nothing on this website should be construed as legal, tax, investment, financial, medical, or other professional advice. In addition, no part of this site—including articles or product references—constitutes a solicitation, recommendation, endorsement, advertisement, or offer to buy or sell any securities, franchises, or other financial instruments, particularly in jurisdictions where such activity would be unlawful.
All content is of a general nature and may not address the specific circumstances of any individual or entity. It is not a substitute for professional advice or services. Any actions you take based on the information provided here are strictly at your own risk. You accept full responsibility for any decisions or outcomes arising from your use of this website and agree to release us from any liability in connection with your use of, or reliance upon, the content or products found herein.