
|
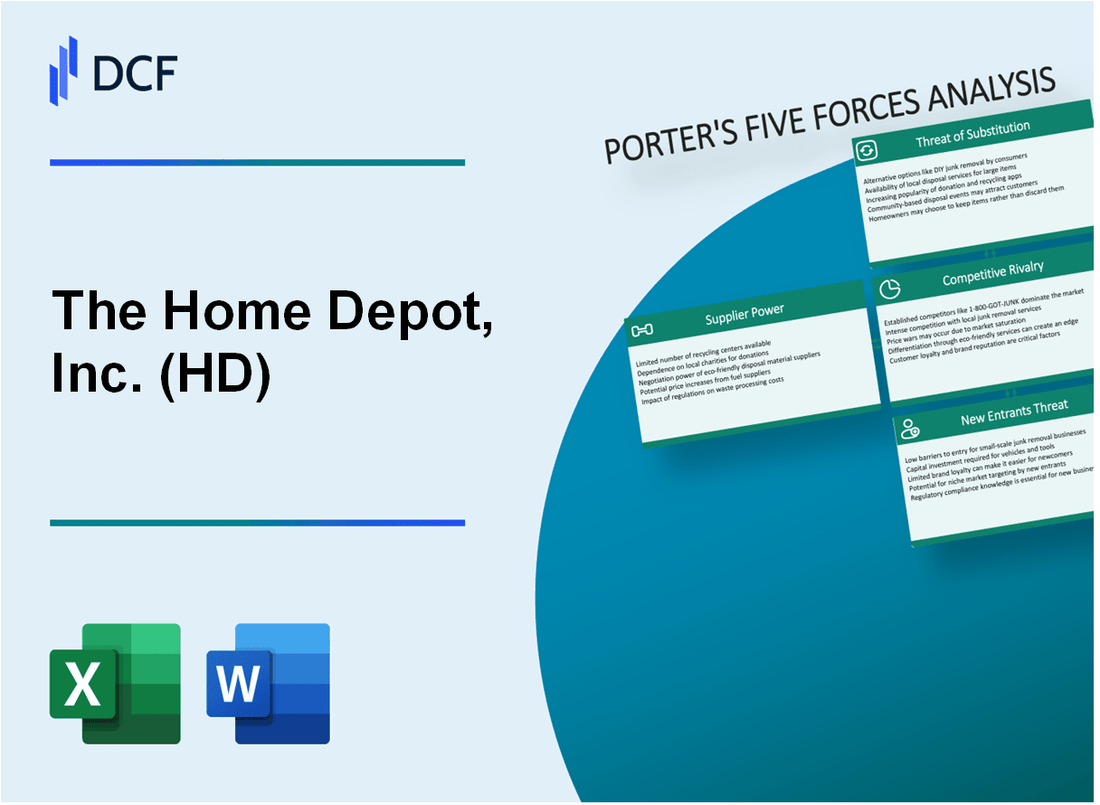
The Home Depot, Inc. (HD): 5 FORCES Analysis [Nov-2025 Updated] |
Fully Editable: Tailor To Your Needs In Excel Or Sheets
Professional Design: Trusted, Industry-Standard Templates
Investor-Approved Valuation Models
MAC/PC Compatible, Fully Unlocked
No Expertise Is Needed; Easy To Follow
The Home Depot, Inc. (HD) Bundle
You're looking at The Home Depot's competitive moat as of late 2025, and frankly, the picture is nuanced. Despite posting Q3 sales of $41.4 billion and projecting total sales growth of about 3.0% for the full fiscal year, the underlying pressure is defintely showing: customer transactions actually dropped 1.4% in Q3, even as the average ticket size reached $90.39. What's more, rival Lowe's has outpaced The Home Depot on comparable sales growth for two straight quarters. We need to see how their aggressive supplier diversification-aiming for no single foreign country to exceed 10% of purchases-and capital expenditures of approximately 2.5% of total sales for fiscal 2025 will hold up against this intense rivalry and cautious consumer spending. Let's break down the five forces shaping The Home Depot's strategy right now.
The Home Depot, Inc. (HD) - Porter's Five Forces: Bargaining power of suppliers
The Bargaining Power of Suppliers for The Home Depot, Inc. is generally low, primarily because of the sheer magnitude of the company's purchasing volume and its extensive distribution footprint. You see, when you're the world's largest home improvement retailer, your orders move mountains. For context, The Home Depot, Inc. reported total sales of $41.4 billion in the third quarter of fiscal 2025. This scale means suppliers are highly dependent on The Home Depot, Inc. for a significant portion of their revenue stream, which naturally limits their ability to dictate terms.
The company's physical and logistical reach further cements this advantage. As of the end of the third quarter of fiscal 2025, The Home Depot, Inc. operated 2,356 retail stores and over 1,200 SRS locations. This network allows The Home Depot, Inc. to demand favorable pricing and service levels, knowing it can move massive quantities of product efficiently across the U.S. and beyond.
Here's a quick look at the scale you're dealing with:
| Metric | Value (Late 2025) |
|---|---|
| Q3 Fiscal 2025 Total Sales | $41.4 billion |
| U.S. Sourced Purchases (Current) | More than 50% |
| Total Retail Stores (Q3 FY2025 End) | 2,356 |
| Target for Single Non-U.S. Country Purchase (Within 12 months of May 2025) | Not more than 10% |
The strategic goal for The Home Depot, Inc. is to actively manage and reduce this supplier power through deliberate diversification. Management has been clear about shifting sourcing away from single high-risk geographies. Currently, more than 50% of its purchases are sourced domestically within the U.S.. Furthermore, the company has set an aggressive target, anticipating that within 12 months from May 2025, no single country outside the U.S. will account for more than 10% of its total purchases. This proactive balancing act ensures that no single international supplier base can hold the retailer hostage with price hikes or supply disruptions.
Also, The Home Depot, Inc. actively works to create supplier lock-in through exclusive product relationships, which directly lowers supplier power. A prime example is the expanded, long-term partnership with Behr Paint Company. This deal secured The Home Depot, Inc. the exclusive big-box retail rights for the entire KILZ® primer line across the U.S. and Puerto Rico. This brand has a long history with the retailer; Behr products have been sold there since 1979, and KILZ primers were added in 1991.
This exclusivity translates directly into high switching costs for those specific suppliers who rely on The Home Depot, Inc. for their primary distribution channel. If a supplier loses this massive outlet, they lose access to a customer base that generated $41.4 billion in sales in just one quarter. The exclusive KILZ deal, for instance, removes that product from competing big-box retailers, making The Home Depot, Inc. the sole destination for Pros needing those specific, industry-standard primers.
The supplier leverage is further constrained by the company's own internal efficiency efforts:
- Using internal productivity gains to offset potential cost increases.
- Strategically adjusting product assortments to drop tariff-affected items.
- Maintaining pricing discipline to avoid passing costs to the consumer.
The Home Depot, Inc. (HD) - Porter's Five Forces: Bargaining power of customers
You're analyzing The Home Depot, Inc.'s position against its customers, and the data shows a clear dynamic: customers, especially DIYers, hold significant leverage right now, primarily due to the ease of shopping elsewhere.
The power of customers is amplified by low switching costs between big-box retailers. When you are looking for a standard item like a box of screws or a gallon of paint, moving from The Home Depot, Inc. to a competitor like Lowe's or even a smaller regional chain is frictionless; you just go to the next store or click a different website. This lack of lock-in forces The Home Depot, Inc. to remain highly competitive on price and availability.
For the DIY segment, this price sensitivity is evident in transaction volume trends. In the third quarter of fiscal 2025, customer transactions (in millions) were down 1.4% compared to the prior year's comparable period, landing at 393.5 million transactions versus 399.0 million. This drop in frequency suggests that even when customers do buy, they are perhaps buying less per trip or shopping less often overall. This is further supported by the (1.6)% decrease in comparable customer transactions for the same quarter. The Home Depot, Inc. reported total net sales of $41.4 billion for the third quarter of fiscal 2025, but the underlying transaction count pressure shows where the leverage lies.
The company is clearly pivoting its focus toward its Pro customers (professional contractors), who typically drive higher-value, less-frequent, and less price-elastic purchases. The Pro segment is crucial for maintaining ticket size. For the three months ended November 2, 2025, the average ticket across all transactions was $90.39. This figure is a key metric management watches, as it represents the average price paid per transaction, which increased 2.0% year-over-year for the quarter.
However, the broader macroeconomic environment is currently working against the leverage of The Home Depot, Inc.'s customers on big-ticket items. Persistently high interest rates are making big discretionary projects softer, which reduces the customer's willingness to commit to large financing-dependent renovations. Even wealthier homeowners are showing hesitation on expensive remodels. This environment pushes customers toward smaller, less discretionary purchases, which plays directly into their bargaining power for better pricing on those smaller baskets.
Here's a quick look at the key transaction dynamics from the third quarter of fiscal 2025:
| Metric | Q3 Fiscal 2025 Value | Year-over-Year Change (Comparable) |
| Net Sales | $41.4 billion | Net Sales increased 2.8% |
| Comparable Sales | N/A | Increased 0.2% |
| Comparable Customer Transactions | N/A | Decreased (1.6)% |
| Customer Transactions (Millions) | 393.5 | Decreased (1.4)% |
| Average Ticket | $90.39 | Increased 2.0% |
The shift in customer behavior is notable when you look at the frequency versus the value of the purchase. While the average ticket is up, the number of times people walk through the door or place an order is declining. This suggests customers are consolidating purchases or delaying non-essential trips.
The pressure on DIY customers is also reflected in broader traffic data, which shows how easily they can choose an alternative:
- Foot traffic per store was down 4.2% in Q1 2025, according to Placer.ai data.
- Big-ticket transactions (over $1,000) saw only a 0.3% increase in Q2 2025, indicating softness in high-value categories.
- The Home Depot, Inc. reported net earnings of $3.6 billion for the quarter, with diluted EPS at $3.62.
- The company is focusing on Pro growth, which drives the higher average ticket of $90.39.
If onboarding takes 14+ days, churn risk rises, and for The Home Depot, Inc., the ease of switching means any friction in the Pro or DIY experience can immediately push a customer to a competitor.
The Home Depot, Inc. (HD) - Porter's Five Forces: Competitive rivalry
The rivalry within the home improvement retail space is extremely high, characterized by a near-duopoly where The Home Depot and Lowe's command the majority of the market. The Home Depot holds a market share of approximately 47%, while Lowe's commands around 28%. The scale difference is evident in projected fiscal 2025 revenues, with The Home Depot slated for $163.9 billion and Lowe's at $84.3 billion.
The competitive intensity has sharpened as Lowe's comparable sales growth has recently outpaced The Home Depot's in 2025, intensifying the fight for market share. While The Home Depot reported Q2 2025 comparable sales growth of 1.0% (with U.S. comps up 1.4%), Lowe's reported outpacing The Home Depot for a second straight quarter in Q3 2025. For the full fiscal 2025, The Home Depot expects comparable sales growth of approximately 1.0%, whereas Lowe's projects comparable sales to be roughly flat for the year.
Competition is aggressively shifting to the Pro segment, a market The Home Depot estimates at over $450 billion annually in the United States. This push is evidenced by The Home Depot completing the $5.5 billion acquisition of GMS Inc. in September 2025 through its SRS Distribution subsidiary. GMS's 2025 revenue was $5.5 billion, and this move is designed to enhance offerings and fulfillment for professional contractors, a segment that previously represented 30% of The Home Depot's sales. The Home Depot's Q1 2025 sales increase of 9.4% was notably driven by its Pro customers.
Amazon and Walmart continue to encroach, particularly in smaller, commodity-type product categories where quick delivery is key. Online home improvement purchases reached a new all-time high of nearly 29% in 2025, with both Amazon and Walmart competing on rapidly delivered items.
Price matching remains a standard practice in many commodity areas, which forces both The Home Depot and Lowe's to compete heavily on service and convenience enhancements. Here's a quick look at the competitive positioning and recent strategic moves:
| Metric/Initiative | The Home Depot (HD) Data | Lowe's (LOW) Data |
|---|---|---|
| Fiscal 2025 Projected Revenue | $163.9 billion | $84.3 billion |
| Fiscal 2025 Projected Comp Sales Growth | Approximately 1.0% | Roughly flat |
| Pro Segment Acquisition Cost | $5.5 billion (GMS) | N/A (Lowe's FBM/ADG integration) |
| Q2 2025 Total Sales | $45.3 billion | N/A for Q2 2025 in search results |
The focus on service is translating into specific operational investments:
- The Home Depot is building out its Pro ecosystem, aiming to have 17 top pro markets equipped with new capabilities by the end of 2024.
- The Home Depot is using AI routing for job site delivery scheduling.
- Lowe's CEO Marvin Ellison cited double-digit productivity gains from using AI tools for development and code review.
- Lowe's is set to achieve its multiyear goal of reducing in-store SKU count by 15% by the end of 2025.
- Lowe's is rolling out a rural store format in 150 more locations.
The Home Depot, Inc. (HD) - Porter\'s Five Forces: Threat of substitutes
You're looking at how other options chip away at The Home Depot, Inc.'s core business, and honestly, the landscape is crowded with alternatives that can satisfy the same customer need.
General retailers are definitely stepping up their game in commodity home improvement products, directly challenging The Home Depot, Inc.'s pricing power on staples. Walmart, for instance, reported U.S. comparable sales growth of 4.5% for the August through October 2025 period, while raising its full-year net sales growth forecast to 4.8% to 5.1%, contrasting with The Home Depot, Inc.'s own Fiscal 2025 total sales growth guidance of approximately 2.8%. Costco, another giant, posted Fiscal Year 2025 net sales of $269.9 billion, an 8.1% increase year-over-year, with U.S. comparable sales (adjusted) at 6.2% for the same period.
| Competitor/Metric | The Home Depot, Inc. (HD) Fiscal 2024 Sales | Competitor Latest Reported Annual/TTM Sales | Competitor Latest U.S. Comparable Sales Growth |
|---|---|---|---|
| The Home Depot, Inc. (HD) | $159.5 billion | N/A | Fiscal 2024 comparable sales decreased 1.8% |
| Walmart | N/A | $165.054B (TTM ending July 31, 2025) | Q3 2025: 4.5% |
| Costco | N/A | $269.9 billion (FY 2025 Net Sales) | FY 2025 U.S. Comparable Sales: 6.2% (Adjusted) |
For the DIY customer looking for advice or labor, professional contractors serve as a direct substitute for the entire project execution. The pressure here is compounded by labor market dynamics; skilled labor is projected to underpace growth by 15% by 2030. Still, the DIY segment remains strong, with 73% of Millennials actively engaging in DIY projects. However, even when they buy materials, 64% of Millennial DIY purchases still happen in-store.
The digital channel is also a growing substitute, offering convenience and often lower overhead costs. While physical retail still accounts for about 83.7% of U.S. retail sales, online sales are a significant force, expected to grow between 7% and 9% year-over-year in 2025, reaching a range of $1.47 trillion to $1.50 trillion. Specifically within building materials, online purchases nearly doubled since 2019, reaching 8.3% of the market as of 2025, with projections suggesting online market share could hit 16% by 2028.
You see this shift reflected in The Home Depot, Inc.'s own numbers, where they are guiding for only a 1.0% comparable sales growth for the comparable 52-week period in Fiscal 2025, while projecting an adjusted diluted EPS decline of approximately 2% from the prior year's $15.24.
- Online channels are used for more than just the final purchase.
- More than half of in-store purchases involve prior online research.
- 72% of in-store shoppers use mobile devices to compare prices.
- Younger generations use YouTube for tutorials (55% of Millennial DIYers).
- Specialty online sellers offer low-cost, direct-to-consumer options.
The Home Depot, Inc. (HD) - Porter's Five Forces: Threat of new entrants
The threat of new entrants for The Home Depot, Inc. remains moderate to low. This is largely because the industry presents extremely high capital barriers and demands significant scale to compete effectively on price and assortment.
Establishing a network comparable to The Home Depot, Inc.'s footprint requires a massive outlay of capital. Building a network of 2,356 large format stores, as reported at the end of the third quarter of fiscal 2025, plus over 1,200 SRS locations, demands immense investment in land acquisition, construction, and inventory holding.
Established economies of scale and deep brand loyalty create a significant cost advantage that new entrants struggle to match. The sheer volume of purchasing power allows The Home Depot, Inc. to negotiate better terms with suppliers, which translates to lower costs on the shelf. Furthermore, the company is actively deploying capital to reinforce this moat. The Home Depot, Inc. plans capital expenditures of approximately 2.5% of total sales in fiscal 2025 to reinforce its position. This commitment is further evidenced by recent, massive strategic investments.
The primary viable entry points for new competition tend to be smaller-format chains or highly specialized distributors rather than direct, full-scale competitors. For instance, smaller players like Ace Hardware operate on a different, often cooperative, model that focuses on localized service rather than overwhelming scale. However, The Home Depot, Inc. has recently spent heavily to lock down professional segments, which raises the barrier for any new specialized distributor.
Here's a look at the scale and recent capital deployment reinforcing these barriers:
| Metric | Value (as of late 2025/Guidance) |
|---|---|
| Total Retail Stores (Q3 FY2025) | 2,356 |
| SRS Locations (Q3 FY2025) | Over 1,200 |
| Planned Capital Expenditures (FY2025 Guidance) | Approximately 2.5% of total sales |
| Planned Capital Expenditures (FY2025 Dollar Amount) | Approximately $4 billion |
| Recent Acquisition Cost (SRS Distribution) | $18.25 billion |
| Recent Acquisition Cost (GMS Inc.) | $5.5 billion |
The magnitude of these recent acquisitions-SRS Distribution for $18.25 billion and GMS Inc. for $5.5 billion-demonstrates a strategy of buying scale and expertise in key professional segments, making it even more difficult for a startup to enter that space organically.
New entrants face significant hurdles related to logistics and customer expectation management. Consider the infrastructure required:
- Securing prime real estate for large-format locations.
- Developing supply chain contracts matching The Home Depot, Inc.'s volume.
- Building out distribution centers, with The Home Depot, Inc. having over 90 across the US.
- Establishing the necessary technology stack, including AI tools like Magic Apron.
To be fair, the threat is not zero. Specialized distributors or niche online players can chip away at specific product categories, but they rarely challenge the core retail footprint. The Home Depot, Inc.'s focus on investing across the business helps maintain its value proposition against these smaller threats.
Finance: model the impact of a sustained 1% market share loss in the Pro segment by 2027, Finance: draft 13-week cash view by Friday.
Disclaimer
All information, articles, and product details provided on this website are for general informational and educational purposes only. We do not claim any ownership over, nor do we intend to infringe upon, any trademarks, copyrights, logos, brand names, or other intellectual property mentioned or depicted on this site. Such intellectual property remains the property of its respective owners, and any references here are made solely for identification or informational purposes, without implying any affiliation, endorsement, or partnership.
We make no representations or warranties, express or implied, regarding the accuracy, completeness, or suitability of any content or products presented. Nothing on this website should be construed as legal, tax, investment, financial, medical, or other professional advice. In addition, no part of this site—including articles or product references—constitutes a solicitation, recommendation, endorsement, advertisement, or offer to buy or sell any securities, franchises, or other financial instruments, particularly in jurisdictions where such activity would be unlawful.
All content is of a general nature and may not address the specific circumstances of any individual or entity. It is not a substitute for professional advice or services. Any actions you take based on the information provided here are strictly at your own risk. You accept full responsibility for any decisions or outcomes arising from your use of this website and agree to release us from any liability in connection with your use of, or reliance upon, the content or products found herein.