
|
The Honest Company, Inc. (HNST): PESTLE Analysis [Nov-2025 Updated] |
Fully Editable: Tailor To Your Needs In Excel Or Sheets
Professional Design: Trusted, Industry-Standard Templates
Investor-Approved Valuation Models
MAC/PC Compatible, Fully Unlocked
No Expertise Is Needed; Easy To Follow
The Honest Company, Inc. (HNST) Bundle
The Honest Company (HNST) is navigating a complex 2025 where its premium pricing faces persistent inflation and a consumer spending shift toward value, even as net revenue is projected to hit near $350 million. The real challenge isn't just the economic squeeze; it's the dual pressure of full compliance with the new Modernization of Cosmetics Regulation Act (MoCRA) deadlines and the intense social media scrutiny over ingredient transparency. You need to understand how this regulatory environment, coupled with the sustained Millennial and Gen Z demand for verifiable Environmental, Social, and Governance (ESG) commitments, impacts their valuation and growth trajectory. Let's dig into the Political, Economic, and Social forces that will defintely shape HNST's next move.
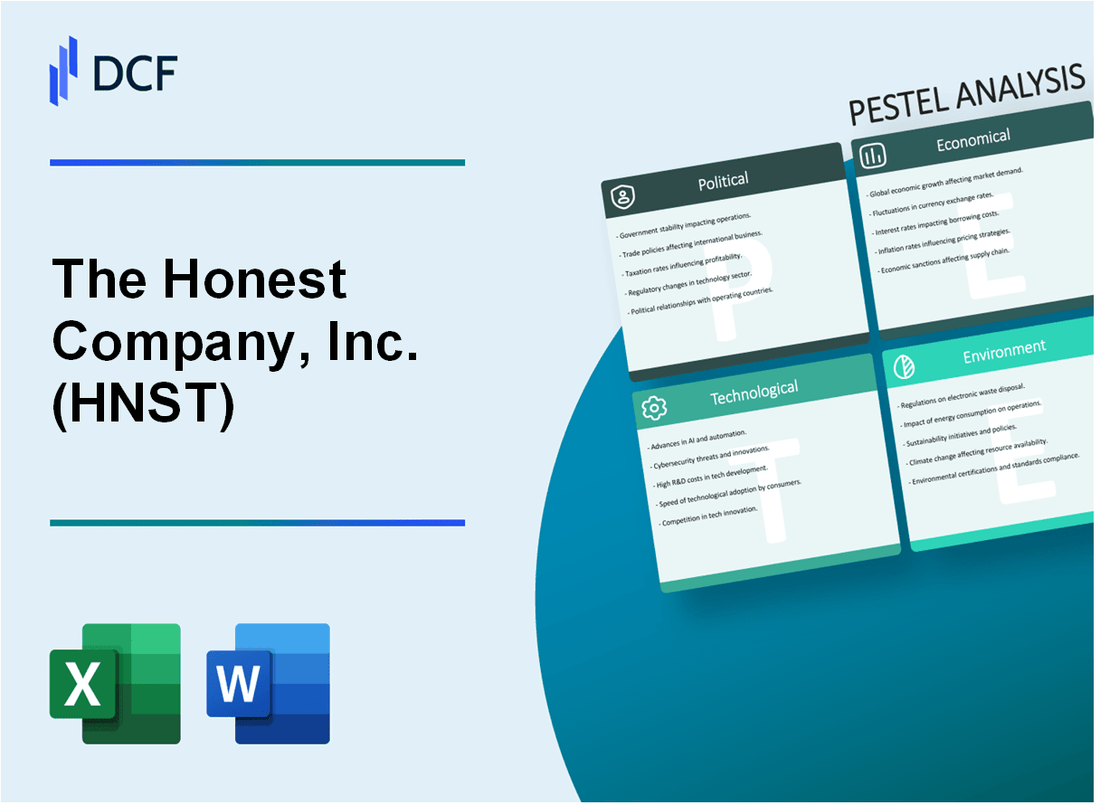
The Honest Company, Inc. (HNST) - PESTLE Analysis: Political factors
Increased enforcement of the Modernization of Cosmetics Regulation Act (MoCRA) in 2025
The Modernization of Cosmetics Regulation Act (MoCRA) is a major political and regulatory shift, creating a new compliance cost layer for The Honest Company, Inc. (HNST) in 2025. This legislation marks the most significant overhaul of U.S. cosmetics law in over 80 years, granting the Food and Drug Administration (FDA) expanded authority over product safety and manufacturing. For a brand built on clean ingredients, compliance is a competitive advantage, but it's defintely not free.
The initial deadlines for facility registration and product listing have passed, but the enforcement is ramping up. As of January 1, 2025, the FDA had logged 9,528 active facility registrations and 589,762 unique product listings, showing widespread industry compliance efforts. The most critical upcoming deadline is the final rule for Good Manufacturing Practices (cGMP), which is expected to be finalized by December 29, 2025, although the proposed rule was delayed until October 2025. This final rule will mandate new, stricter quality control and recordkeeping systems, requiring steep investments for larger firms like Honest. To be fair, a portion of Honest's portfolio, such as its sunscreen and acne treatments, are already classified as over-the-counter (OTC) drugs, which means they already follow stricter cGMP standards. This existing compliance infrastructure should help mitigate some of the new costs for those specific product lines.
Trade policies and tariffs impacting raw material sourcing from Asia
Trade policy uncertainty, particularly the ongoing U.S.-China rivalry, remains a significant political headwind that directly impacts The Honest Company, Inc.'s cost of goods sold. The company has already quantified this risk for the fiscal year 2025, projecting a $8 million gross tariff exposure. This is a concrete financial risk that management must offset through cost savings and supply chain agility.
The broader cosmetics industry faces a tough environment, with the Tax Foundation projecting a potential 25.8% average tariff rate on imports in 2025. This is driven by tariffs on imported raw materials and, critically, packaging components sourced from China, where some duties can reach 34% or higher. Honest's strategy to mitigate this political risk involves a supply chain shift, a trend called 'friendshoring' in the industry, which moves sourcing to politically safer, tariff-exempt regions. The company's focus on margin enhancement is directly tied to managing this tariff exposure, and they are leveraging operational discipline to keep their full-year 2025 Adjusted EBITDA guidance in the range of $27 million to $30 million.
Government support or subsidies for sustainable manufacturing practices
The U.S. political landscape offers tangible financial opportunities for The Honest Company, Inc. through incentives aimed at sustainable manufacturing, aligning perfectly with the brand's core mission. While direct subsidies are rare, tax credits for capital investment and innovation are readily available, and Honest should be aggressively pursuing them.
Here's the quick math on key federal incentives for manufacturers in 2025:
- R&D Tax Credit: For improving product formulations or refining sustainable manufacturing processes, a qualified small to mid-sized firm can save between $50,000 and $250,000 annually.
- Investment Tax Credit (IRC 48C): This program provides up to $10 billion in tax credits for investments in new or re-equipped manufacturing facilities that produce emissions-reducing technologies. The base credit is 6% of the qualified investment, but it can increase to 30% if prevailing wage and apprenticeship requirements are met.
The company's investment in energy-efficient equipment or new processes for its 'clean' product lines, such as sustainable packaging solutions, can be directly subsidized or deducted through these mechanisms. This is a clear opportunity to lower the effective cost of capital for sustainability upgrades.
Political stability in key international expansion markets
The Honest Company, Inc.'s international footprint is currently concentrated in the U.S., Canada, and Europe. The political stability in these regions, specifically concerning trade agreements, is a core factor in their 2025 distribution expansion strategy. For example, the fact that Honest's diapers are certified as USMCA-compliant (United States-Mexico-Canada Agreement) is a huge political win, exempting them from the March 4, 2025 tariff on goods from Mexico and ensuring stable access to the Canadian market.
Still, the global political environment for multinational corporations (MNCs) is increasingly volatile. General geopolitical risks for 2025 include escalating trade wars, rising protectionism, and increased political violence, which can disrupt supply chains and consumer confidence in the European market. The company's continued success in achieving its projected 4% to 6% net revenue growth for 2025 depends on maintaining political and trade stability in its existing key markets and managing the costs of geopolitical friction in its Asian sourcing network.
| Political Factor | 2025 Impact on Honest Company, Inc. (HNST) | Key Financial/Statistical Data |
|---|---|---|
| MoCRA cGMP Final Rule | Increased compliance and CapEx for manufacturing facilities. | Final rule deadline: December 29, 2025. Total industry product listings as of Jan 1, 2025: 589,762. |
| US-Asia Trade Tariffs | Direct hit to cost of goods sold (COGS) and margin pressure. | Projected $8 million gross tariff exposure for HNST in 2025. Industry average tariff rate on imports: 25.8%. |
| Sustainable Manufacturing Incentives | Opportunity to offset capital costs for clean/green upgrades. | Investment Tax Credit (IRC 48C) base credit: 6% of qualified investment (up to 30%). R&D Tax Credit savings: $50,000 to $250,000 annually for mid-sized firms. |
| International Trade Stability | Ensures stable distribution in North American markets. | Diapers are USMCA-compliant, exempt from March 2025 Mexican tariffs. Focus markets: U.S., Canada, and Europe. |
The Honest Company, Inc. (HNST) - PESTLE Analysis: Economic factors
Analyst projections estimate 2025 net revenue near $350 million, a moderate growth.
You need to know that The Honest Company, Inc. (HNST) is navigating a challenging economic environment, which has forced a significant revision in its 2025 financial outlook. The company's official guidance for full-year 2025 net revenue was revised in November 2025 to a range of a 3% decrease to flat growth year-over-year, down from an earlier projection of 4% to 6% growth.
Here's the quick math: with 2024 annual revenue at $378.34 million, the revised outlook suggests 2025 net revenue will land between approximately $367 million and $378 million. Still, some analyst models, factoring in the full impact of their strategic exits (Transformation 2.0), estimate net revenue closer to $350 million. This is a moderate growth scenario for the core business, but the overall top-line revenue is struggling due to the wind-down of non-strategic, lower-margin categories that represented about 22% of Q3 2025 revenue.
| Key Financial Metric (FY 2025 Outlook) | Value/Range | Impact on Economic Strategy |
|---|---|---|
| Net Revenue Outlook (Revised) | -3% to flat (approx. $367M - $378M) | Requires intense focus on high-growth, high-margin 'Organic Revenue' segments. |
| Adjusted EBITDA Outlook (Revised) | $21 million to $23 million | Shows profitability resilience despite revenue headwinds; supports operational efficiency focus. |
| Cash and Cash Equivalents (Q3 2025) | $71 million | Strong liquidity; provides a buffer against macroeconomic uncertainty. |
Persistent inflationary pressure on raw material costs, especially natural ingredients.
Inflation is defintely hitting the cost of goods sold (COGS), which is a major headwind for a clean-label company like Honest Company. Raw material and packaging costs remain volatile in 2025, driven by global supply chain constraints and energy price hikes. For instance, key commodities like palm oil, used in many personal care products, are seeing prices influenced by strong demand for biodiesel and weather events, keeping the cost floor high.
The gross margin compression is a clear sign of this pressure. In Q3 2025, the gross margin dropped to 37.3%, a decrease of 140 basis points year-over-year. A significant part of this is due to tariffs, which are anticipated to have a gross exposure of roughly $8 million for the full year 2025. This forces the company to aggressively seek cost savings and operational efficiencies just to maintain its margin profile.
- Gross tariff exposure: Estimated $8 million for full year 2025.
- Q3 2025 Gross Margin: 37.3%, down 140 bps year-over-year.
- Core challenge: Balancing premium ingredient costs with consumer price sensitivity.
Consumer spending shifts favoring value, potentially pressuring HNST's premium pricing.
The US consumer is showing a split personality in 2025. While the overall wellness market is booming-projected to reach $1.8 trillion with consumers prioritizing health and ethics-the majority of shoppers are becoming more price-sensitive. About 76% of US consumers are actively trading down for better value in some categories. This puts Honest Company's premium-priced, clean-formulated products, especially in categories like diapers, under pressure.
When inflation bites, consumers often switch from national brands to private-label alternatives; 36% of consumers planned to buy private-label products more frequently in 2024, believing the quality is comparable. For Honest Company, the opportunity lies in the fact that a subset of consumers is still willing to pay a premium for high-quality, ethically sourced products. The challenge is ensuring the brand's value proposition-clean, sustainable-is strong enough to justify the price difference against both conventional and private-label competitors.
Interest rate environment impacting capital expenditure for supply chain improvements.
The current high-interest rate environment generally makes borrowing for large capital projects expensive, but Honest Company is well-insulated from this direct impact. The company operates with no debt on its balance sheet as of September 30, 2025. This low-leverage model means they aren't subject to the risk of rising interest rates on CapEx.
However, the company's capital expenditure (CapEx) for investing activities remains low and consistent, at only $263 thousand for the nine months ended September 30, 2025. While this fiscal discipline is good, it limits the speed at which they can invest heavily in major supply chain improvements, like automation or new manufacturing facilities, which are crucial for long-term cost reduction and margin expansion. They are funding strategic initiatives, such as inventory builds for tariff mitigation, directly from cash flow.
The Honest Company, Inc. (HNST) - PESTLE Analysis: Social factors
The Honest Company, Inc.'s social environment is a double-edged sword: a powerful, sustained consumer demand for 'clean' products provides a massive tailwind, but this is complicated by a core demographic headwind from falling birth rates and intense social scrutiny that demands verifiable action, not just marketing.
Strong, sustained demand for 'clean' and 'free-from' personal care and baby products.
The market shift toward health-conscious consumption is a primary driver for The Honest Company's business. Consumers are defintely prioritizing ingredient transparency and the avoidance of synthetic chemicals like parabens and sulfates. The US Organic Personal Care Market, which is a key segment for the company, was valued at $3.01 billion in 2024 and is projected to reach $5.10 billion by 2030, representing a CAGR of 9.25%. This is not a niche trend; a significant 74% of consumers consider organic ingredients important when purchasing personal care products.
The company's recent performance reflects this strong demand, particularly in non-diaper categories. Here's the quick math on the core categories' consumption growth in the first half of 2025, which are now driving approximately 80% of total revenue:
- Wipes consumption grew over 40% in Q1 2025 and 35% in Q2 2025.
- Baby Personal Care consumption was up 10% in Q2 2025.
The global organic personal care market size alone reached $34.2 billion in 2025, showing the sheer scale of the opportunity for a brand built on this foundational promise.
Growing Millennial and Gen Z preference for brands with clear, verifiable Environmental, Social, and Governance (ESG) commitments.
Millennials and Gen Z are the most powerful consumer force demanding ESG accountability, which plays directly into The Honest Company's founding mission. This demographic is willing to put their money where their values are, creating a premium pricing opportunity. For instance, 62% of Gen Z shoppers prefer to buy from sustainable brands. Furthermore, 73% of Gen Z and 65% of Millennials report being willing to pay more for environmentally sustainable products.
This willingness to pay a premium is even more pronounced in the personal care space: 62% of younger consumers (ages 18 to 29) are willing to pay more for certified personal care products with organic ingredients, compared to 45% of the general population. The Honest Company's Certified B Corporation status and clean-label focus are essential assets in capturing this high-value consumer base.
Increased social media scrutiny of product claims and ingredient transparency.
The digital age means product claims are instantly fact-checked and amplified across social media platforms, making transparency a non-negotiable operational requirement. Consumers, especially younger ones, are highly skeptical of vague marketing claims (greenwashing). Only 9% of Americans completely trust voluntary labels, and about 65% of adults report finding it difficult to determine if a brand is overstating its eco-friendliness.
This social scrutiny means The Honest Company must maintain its rigorous third-party certifications and ingredient clarity. Gen Z, for example, demands brand action not just talk, which means the company's social impact must be tangible and verifiable, or it risks a significant and rapid brand backlash. The requirement for a clear ingredient list is high, with 65% of consumers actively seeking this to identify potentially harmful components.
Demographic trends showing a slight decrease in US birth rates, impacting the core baby category.
The long-term demographic trend of declining US birth rates presents a structural headwind, which is clearly visible in the Diaper and Baby Apparel segments. While the number of births saw a slight uptick of 1% from 2023 to 3,628,934 in 2024, the General Fertility Rate (GFR) still declined by 1% to 53.8 births per 1,000 females ages 15-44. The overall birth rate was 11.0 per 1,000 population in 2023.
This trend forces the company to focus on capturing a higher share of a smaller market by emphasizing premium, high-margin offerings. The Honest Company's diaper business saw a year-over-year decline of -7% in the third quarter of 2025, which management attributed partly to its 'Transformation 2.0' strategy of exiting lower-margin products. The market is shifting from volume to value, as parents with smaller families often have greater disposable income to invest in higher-quality, premium products. This is why the strategic pivot to focus on high-growth, higher-margin categories like Wipes and Personal Care is critical for the company's profitability.
| US Demographic/Consumer Trend (2025 Data) | Core Statistic/Value | Impact on The Honest Company, Inc. (HNST) |
|---|---|---|
| US General Fertility Rate (GFR) Decline (2023-2024) | Down 1% to 53.8 births per 1,000 women 15-44. | Structural headwind for the Diaper segment, requiring a focus on market share gain and premiumization (higher price/unit). |
| Organic Personal Care Market CAGR (2024-2030) | Projected 9.25% growth. | Significant tailwind for the Personal Care and Wipes segments, justifying increased investment and innovation. |
| Gen Z Willingness to Pay More for Sustainable Products | 73% of Gen Z are willing to pay more. | Supports the brand's premium pricing strategy and high-margin product mix, provided ESG claims are transparent. |
| Consumer Demand for Ingredient Transparency | 65% of consumers want a clear ingredient list. | Reinforces the competitive advantage of the 'clean' and 'free-from' brand promise, but increases risk from any product claim misstep. |
The Honest Company, Inc. (HNST) - PESTLE Analysis: Technological factors
Rapid advancements in e-commerce and direct-to-consumer (DTC) personalization tools.
The Honest Company is navigating a complex technological shift in its sales channels, moving away from its own low-margin direct-to-consumer (DTC) platform, Honest.com. This is a strategic move, but it carries a risk of losing direct customer data. The company is actively exiting its own e-commerce fulfillment channel as part of its Transformation 2.0 strategy.
For the third quarter of 2025, revenue from Honest.com was down 23% year-over-year and represented about 10% of the total business. However, the pivot to omnichannel distribution is showing strength in digital retail partners, where consumption grew by 26% at the largest digital retailer in the second quarter of 2025. You can see the shift clearly:
- Own DTC Channel (Honest.com): Revenue down 23% in Q3 2025.
- Digital Retail Partner Channel: Consumption up 26% in Q2 2025.
The technological challenge now is to maintain the brand's core value of personalized customer experience-which is a baseline expectation in 2025-by effectively integrating with and leveraging the data from these high-growth retail partners. Honestly, you need that first-party data (data collected directly from customers) to fuel personalization engines (AI-driven tools that tailor content and product recommendations).
Supply chain digitalization (e.g., blockchain) to enhance ingredient traceability and transparency.
For a brand built on clean ingredients and transparency, the adoption of supply chain digitalization is a non-negotiable technological imperative, not a choice. By 2025, an estimated 85% of consumers demand proof of ethical sourcing, making a transparent supply chain a cost of entry, not a differentiator.
While The Honest Company has not publicly announced a specific blockchain or digital ledger technology (DLT) implementation, the pressure to adopt one is immense. Blockchain creates an immutable (unchangeable) record of a product's journey from raw material to shelf, which is the ultimate proof of ingredient safety and ethical sourcing. Companies that adopt this technology can see cost savings of up to 30% and slash audit costs by 35% due to streamlined compliance.
The lack of a fully digital traceability system is a clear risk, especially as the company faces supply chain headwinds. For instance, the company is managing an estimated gross tariff exposure of roughly $8 million for the full year 2025, a cost that could be partially mitigated by the faster, more efficient compliance and risk detection that a digital supply chain provides. It's a tech investment that pays for itself in trust and lower costs.
Investment in AI-driven demand forecasting to reduce inventory waste.
The Honest Company's 'Transformation 2.0' is heavily focused on Margin Enhancement and Operating Discipline, and AI-driven demand forecasting is the clearest path to achieving those goals. The company's gross margin was 37.3% in Q3 2025, a decrease of 140 basis points, partly due to volume deleveraging.
To fix this, they need to reduce inventory risk. AI-powered demand forecasting analyzes vast datasets-like sales history, social media trends, and even weather-to predict demand at a granular level. The technology is proven to reduce inventory costs by 20-30% and improve forecast accuracy by up to 65%. Here's the quick math: reducing excess inventory frees up cash that's currently trapped in warehouses, and better forecasting helps avoid costly stockouts or overstocking.
This is defintely a core technology investment that directly supports the financial strategy of the company. Without it, the company risks continued margin pressure from unexpected volume shifts, especially as it simplifies its product assortment to focus on core categories like wipes and personal care.
New material science innovations offering more sustainable and cost-effective packaging.
This area is a major technological strength for The Honest Company, aligning perfectly with its brand mission and the broader consumer trend toward sustainability. The company has made concrete, measurable investments in material science that drive both its brand equity and its cost-saving initiatives.
Key technological adoptions include:
- Cartons: Using 100% tree-free paper made from upcycled sugarcane by-product for secondary packaging.
- Materials: Incorporating Post-Consumer Recycled (PCR) materials, glass droppers, aluminum tubes, and tin compacts across over 100 SKUs.
- Refill Systems: Designing refillable products, such as the Shampoo + Body Wash Refill, which uses 89% less plastic than three 10 oz bottles.
These innovations are crucial because they offer a path to cost-effectiveness (e.g., lighter shipping weights, cheaper raw materials like sugarcane by-product) while maintaining a premium brand position. This is where technology and brand value intersect to create a competitive advantage.
The Honest Company, Inc. (HNST) - PESTLE Analysis: Legal factors
You're looking at The Honest Company, Inc. (HNST) in late 2025, and the legal landscape is not just about compliance; it's a critical driver of your cost structure and product strategy. The biggest near-term impact is the shift from voluntary to mandatory federal oversight under the Modernization of Cosmetics Regulation Act (MoCRA), plus a flurry of aggressive state-level chemical bans. This is a high-stakes environment where a single misstep on a formulation or a data breach can wipe out a quarter's net income.
Here's the quick math: The company's full-year 2025 Adjusted EBITDA guidance is already lowered to a range of $21 million to $23 million. Any significant legal fine or a required, costly, last-minute reformulation due to non-compliance would directly hit that bottom line. You defintely need to budget for the increased compliance and legal overhead.
Full compliance deadlines for MoCRA, including mandatory adverse event reporting and facility registration.
The Modernization of Cosmetics Regulation Act (MoCRA) is forcing a regulatory overhaul for all cosmetic and personal care products, ending the era of lax federal oversight. For Honest Company, Inc., which is well above the small business threshold (annual U.S. cosmetic revenue over $1,000,000), compliance is mandatory and ongoing. The initial deadlines for facility registration and product listing already passed on July 1, 2024, but the most resource-intensive requirement is fast approaching.
The critical near-term deadline is the final rule for Good Manufacturing Practices (cGMP), which is expected to be finalized by December 29, 2025. This means the company must have robust, documented quality control systems in place, mirroring those for Over-The-Counter (OTC) drugs (like their SPF and acne products), across all cosmetic lines. Also, the mandatory reporting of all serious adverse events (hospitalizations, life-threatening conditions) has been enforced since December 29, 2023, requiring reports to the FDA within 15 business days of receipt.
Here is a summary of the critical MoCRA compliance dates for late 2025:
| MoCRA Requirement | Status / Deadline | Impact on Honest Company, Inc. |
|---|---|---|
| Facility Registration & Product Listing | Mandatory, Annual Renewal (Initial Deadline: July 1, 2024) | Requires continuous maintenance and annual renewal for all products and manufacturing sites. |
| Serious Adverse Event Reporting | Enforced (Effective: December 29, 2023) | Must submit reports to FDA within 15 business days of receiving a complaint. |
| Good Manufacturing Practices (cGMP) Final Rule | Deadline Approaching: December 29, 2025 | Requires significant investment in internal quality control, documentation, and vendor auditing. |
| PFAS Safety Assessment | Deadline: December 29, 2025 | Mandatory assessment of all per- and polyfluoroalkyl substances (PFAS) used in cosmetic products. |
Stricter state-level chemical bans (e.g., PFAS, phthalates) requiring continuous product reformulation.
State governments are moving faster than the FDA, creating a patchwork of laws that forces national brands like Honest Company, Inc. to reformulate to the strictest standard. This is a continuous operational challenge that drives up R&D costs. The core issue is that Honest Company, Inc.'s brand promise is built on being 'cleanly-formulated,' so they have to stay ahead of these bans to maintain consumer trust, even if it means higher costs.
The most impactful bans that took effect in 2025 include:
- California's Toxic-Free Cosmetics Act, which banned 24 ingredients as of January 1, 2025.
- Colorado's law restricting intentionally added PFAS (per- and polyfluoroalkyl substances) in personal care products, also effective January 1, 2025.
- Maryland's ban on dozens of intentionally added ingredients, effective January 1, 2025.
Washington state's law is one of the most stringent, banning chemicals like formaldehyde, phthalates, and PFAS. The company must ensure all products sold nationwide meet the Washington or California standard, or they risk fines of up to $5,000 per violation in places like Colorado. This continuous reformulation pressure is a major capital expenditure risk, especially when the company is already undergoing a major strategic shift with its Transformation 2.0 program, which carries one-time costs of $25 million to $35 million.
Intellectual property (IP) protection for proprietary ingredient blends and formulations.
For a brand whose value proposition is tied to 'The Honest Standard' and 'cleanly-formulated' products, the most critical legal asset is its Intellectual Property (IP). While the company holds patents on certain technologies, the true core of a clean-beauty brand lies in its proprietary ingredient blends and manufacturing processes, which are often protected as trade secrets (information kept confidential to maintain a competitive edge).
Protecting these formulations is paramount because a leak or reverse-engineering by a competitor could instantly erode the brand's competitive moat. This requires rigorous legal and operational controls, including non-disclosure agreements (NDAs) with suppliers and manufacturers, and aggressive defense of its trademarks. The company has a history of defending its trademarks, which shows a willingness to enforce its brand identity in court. The legal team must focus on fortifying the trade secret status of the new Clean Conscious Diapers formulation and other core products, as this is the only way to protect the unique ingredient mixes that justify a price premium.
Evolving privacy laws (e.g., CCPA expansion) governing customer data use in marketing.
As a digitally-native company that relies on targeted online advertising and email campaigns, Honest Company, Inc. is heavily exposed to the evolving landscape of consumer data privacy laws. The California Consumer Privacy Act (CCPA), as expanded by the California Privacy Rights Act (CPRA), sets the national standard, and the company's annual gross revenue is far above the $26,625,000 compliance threshold.
The most recent regulatory updates, finalized in September 2025, will take effect on January 1, 2026, demanding immediate action. These changes directly impact the company's digital marketing spend, which saw an increase of $1.6 million in Q3 2025 to support the new diaper launch.
The new requirements create real operational friction for marketing, requiring the company to:
- Obtain explicit consent for using Sensitive Personal Information (which now includes behavioral tracking patterns).
- Implement technical mechanisms like the Global Privacy Control (GPC) signal to honor opt-out requests automatically.
- Avoid 'dark patterns' (deceptive consent mechanisms) when asking consumers to opt-in.
- Prepare for mandatory Risk Assessment duties, which begin January 1, 2026.
The risk here is not just fines-like the $1.35 million fine levied against a major retailer for vendor contract failures under CCPA-but a reduction in the effectiveness of the marketing spend, which is crucial for driving the company's positive consumption metrics (wipes portfolio up 24% and baby personal care up 10% in Q3 2025).
The Honest Company, Inc. (HNST) - PESTLE Analysis: Environmental factors
Pressure from NGOs and consumers to achieve net-zero carbon emissions by 2030.
The Honest Company faces intense pressure from consumers and non-governmental organizations (NGOs) to align with the Paris Agreement goal of limiting global warming to 1.5°C, which necessitates a near-term target to halve emissions by 2030 and reach net-zero by 2050. While the company actively offsets carbon emissions related to its headquarters, warehousing, manufacturing, product shipping, and corporate travel, it has not publicly committed to a specific, Science-Based Targets initiative (SBTi) aligned net-zero by 2030 goal.
This absence of a concrete 2030 target creates a perception risk, especially as competitors face increasing scrutiny. The regulatory landscape is also tightening in the US; for instance, California's SB 253 will mandate Scope 1 and 2 emissions disclosure by 2026 for companies with over $1 billion in revenue. Given that The Honest Company's full-year 2025 total revenue outlook is between $367 million and $378 million, they do not yet fall under this mandatory reporting. Still, the market expects this transparency. The risk is that a lack of Scope 3 (value chain) emissions data makes it impossible to show a true path to net-zero, and Scope 3 is often the largest component for consumer goods companies.
Increased cost and regulation around sustainable packaging and plastic reduction targets.
Moving away from virgin plastic (petroleum-based plastic) is a core strategy, but it carries a financial and operational burden in the near term. The Honest Company is committed to dramatically reducing virgin plastic in its packaging, focusing on post-consumer resin (PCR), glass, and paper alternatives. This shift insulates them from future plastic taxes and regulatory costs, but the current cost of PCR materials remains a headwind.
The company has made tangible progress, but the industry is broadly struggling to meet voluntary 2025 targets, which suggests that The Honest Company, too, will continue to invest heavily in this area beyond the current fiscal year. Here's the quick math on their packaging status: in 2024, 85% of their packaging was reported as recyclable, compostable, or made from sustainable materials. They need to close that remaining gap, which is usually the most expensive part of the transition.
- 100% of Honest.com shipping cartons use pre- or post-consumer recycled (PCR) cardboard.
- 100% of Baby Personal Care and household cleaning bottles are recyclable or include recycled materials.
- One Shampoo + Body Wash Refill uses 89% less plastic than three 10 oz Honest Shampoo + Body Washes.
- Clean Conscious Wipes are now compostable, reducing microplastics.
Water usage restrictions and sourcing ethics for botanical ingredients.
Water stewardship and ethical sourcing are critical components of the clean beauty and baby care market, especially since the company's core products rely on botanical and plant-derived ingredients. The Honest Company's core value proposition is built on using natural, organic, and sustainably harvested raw materials, which is a strong competitive advantage but also a supply chain vulnerability.
While the company emphasizes ethical sourcing and uses third-party verification for biobased content, specific public data on water consumption (a key metric for manufacturing) is not readily disclosed in 2025. This lack of transparency is a strategic blind spot, as water scarcity is a growing global risk. To be fair, most of the water-intensive processes happen at the contract manufacturer level, but investors still want to see the metric. The company mitigates this risk by requiring partners to abide by their Supplier's Code of Conduct, which addresses environmental standards.
Need to secure third-party certifications (e.g., EWG Verified, USDA Organic) to validate claims.
For a brand built on transparency and safety, third-party certifications are non-negotiable; they are the external audit that validates the company's premium price point. The Honest Company has defintely prioritized this, which is a clear strength against mass-market competitors.
The following table illustrates the key certifications the company actively maintains, which directly supports its premium brand positioning and consumer trust:
| Certification Body | Standard/Program | Strategic Value in 2025 |
|---|---|---|
| Environmental Working Group (EWG) | EWG Verified® | Validates products are free from EWG's chemicals of concern, directly addressing consumer anxiety over ingredient safety. |
| U.S. Department of Agriculture (USDA) | National Organic Program (USDA Organic Seal) | Applies to over a dozen products (e.g., Organic Infant Formula, Organic Healing Balm), ensuring a minimum of 95% organic ingredients. |
| USDA | BioPreferred Program | Certifies products for their biobased content, confirming the use of renewable agricultural, marine, and forestry materials. |
| National Eczema Association (NEA) | Seal of Acceptance | Validates product suitability for sensitive skin, a key demographic for baby and personal care. |
| Quality Assurance International (QAI) | NSF/ANSI 305 Standard | Ensures compliance for personal care products containing organic ingredients, a step below the full USDA seal. |
This comprehensive certification portfolio is a powerful barrier to entry for new competitors. Finance: continue to track the cost of maintaining these certifications (audits, ingredient sourcing premiums) against the premium pricing they enable.
Disclaimer
All information, articles, and product details provided on this website are for general informational and educational purposes only. We do not claim any ownership over, nor do we intend to infringe upon, any trademarks, copyrights, logos, brand names, or other intellectual property mentioned or depicted on this site. Such intellectual property remains the property of its respective owners, and any references here are made solely for identification or informational purposes, without implying any affiliation, endorsement, or partnership.
We make no representations or warranties, express or implied, regarding the accuracy, completeness, or suitability of any content or products presented. Nothing on this website should be construed as legal, tax, investment, financial, medical, or other professional advice. In addition, no part of this site—including articles or product references—constitutes a solicitation, recommendation, endorsement, advertisement, or offer to buy or sell any securities, franchises, or other financial instruments, particularly in jurisdictions where such activity would be unlawful.
All content is of a general nature and may not address the specific circumstances of any individual or entity. It is not a substitute for professional advice or services. Any actions you take based on the information provided here are strictly at your own risk. You accept full responsibility for any decisions or outcomes arising from your use of this website and agree to release us from any liability in connection with your use of, or reliance upon, the content or products found herein.