
|
Hancock Whitney Corporation (HWC) DCF Valuation |
Fully Editable: Tailor To Your Needs In Excel Or Sheets
Professional Design: Trusted, Industry-Standard Templates
Investor-Approved Valuation Models
MAC/PC Compatible, Fully Unlocked
No Expertise Is Needed; Easy To Follow
Hancock Whitney Corporation (HWC) Bundle
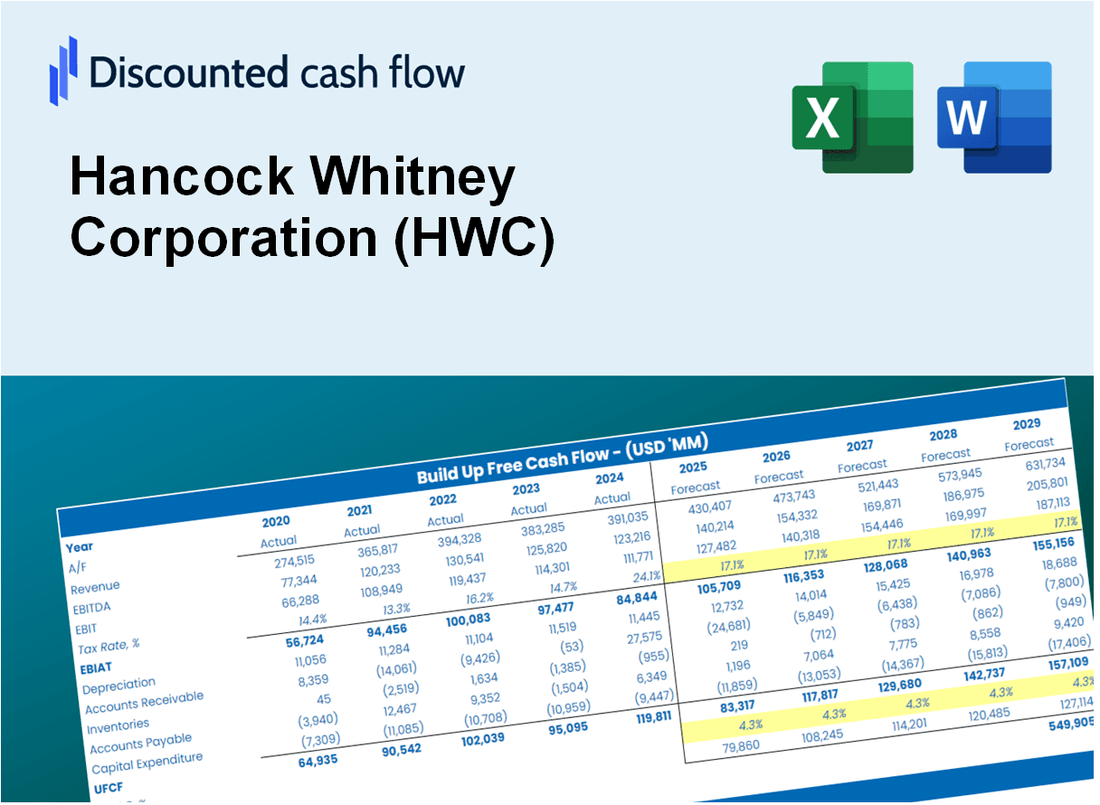
Optimize your time and improve precision with our (HWC) DCF Calculator! Utilizing real data from Hancock Whitney Corporation and customizable assumptions, this tool empowers you to forecast, analyze, and evaluate (HWC) just like a seasoned investor.
Discounted Cash Flow (DCF) - (USD MM)
| Year | AY1 2020 |
AY2 2021 |
AY3 2022 |
AY4 2023 |
AY5 2024 |
FY1 2025 |
FY2 2026 |
FY3 2027 |
FY4 2028 |
FY5 2029 |
|---|---|---|---|---|---|---|---|---|---|---|
| Revenue | 1,382.4 | 1,345.2 | 1,465.5 | 1,889.6 | 2,049.3 | 2,272.9 | 2,520.9 | 2,795.9 | 3,101.0 | 3,439.3 |
| Revenue Growth, % | 0 | -2.69 | 8.94 | 28.94 | 8.45 | 10.91 | 10.91 | 10.91 | 10.91 | 10.91 |
| EBITDA | -74.7 | 613.8 | 704.8 | 536.4 | 615.7 | 667.1 | 739.9 | 820.6 | 910.2 | 1,009.5 |
| EBITDA, % | -5.4 | 45.63 | 48.1 | 28.39 | 30.04 | 29.35 | 29.35 | 29.35 | 29.35 | 29.35 |
| Depreciation | 50.0 | 45.8 | 45.6 | 46.3 | 41.7 | 66.5 | 73.7 | 81.8 | 90.7 | 100.6 |
| Depreciation, % | 3.62 | 3.4 | 3.11 | 2.45 | 2.04 | 2.92 | 2.92 | 2.92 | 2.92 | 2.92 |
| EBIT | -124.7 | 568.1 | 659.2 | 490.1 | 574.0 | 600.7 | 666.2 | 738.9 | 819.5 | 908.9 |
| EBIT, % | -9.02 | 42.23 | 44.98 | 25.94 | 28.01 | 26.43 | 26.43 | 26.43 | 26.43 | 26.43 |
| Total Cash | 7,859.0 | 11,218.1 | 6,443.8 | 6,103.0 | 6,675.7 | 2,272.9 | 2,520.9 | 2,795.9 | 3,101.0 | 3,439.3 |
| Total Cash, percent | .0 | .0 | .0 | .0 | .0 | .0 | .0 | .0 | .0 | .0 |
| Account Receivables | 205.6 | 225.0 | 166.9 | 214.9 | 162.4 | 283.2 | 314.0 | 348.3 | 386.3 | 428.5 |
| Account Receivables, % | 14.87 | 16.73 | 11.39 | 11.37 | 7.93 | 12.46 | 12.46 | 12.46 | 12.46 | 12.46 |
| Inventories | .0 | .0 | .0 | .0 | .0 | .0 | .0 | .0 | .0 | .0 |
| Inventories, % | 0 | 0 | 0 | 0 | 0 | 0 | 0 | 0 | 0 | 0 |
| Accounts Payable | 4.3 | 3.1 | 9.9 | 45.0 | 20.1 | 20.8 | 23.1 | 25.6 | 28.4 | 31.5 |
| Accounts Payable, % | 0.31214 | 0.23068 | 0.67795 | 2.38 | 0.98316 | 0.91708 | 0.91708 | 0.91708 | 0.91708 | 0.91708 |
| Capital Expenditure | -37.9 | -23.5 | -29.1 | -25.0 | -10.2 | -37.7 | -41.9 | -46.4 | -51.5 | -57.1 |
| Capital Expenditure, % | -2.74 | -1.75 | -1.99 | -1.32 | -0.49954 | -1.66 | -1.66 | -1.66 | -1.66 | -1.66 |
| Tax Rate, % | 19.71 | 19.71 | 19.71 | 19.71 | 19.71 | 19.71 | 19.71 | 19.71 | 19.71 | 19.71 |
| EBITAT | -45.2 | 463.2 | 524.1 | 392.6 | 460.8 | 429.6 | 476.5 | 528.5 | 586.2 | 650.1 |
| Depreciation | ||||||||||
| Changes in Account Receivables | ||||||||||
| Changes in Inventories | ||||||||||
| Changes in Accounts Payable | ||||||||||
| Capital Expenditure | ||||||||||
| UFCF | -234.3 | 464.8 | 605.5 | 400.9 | 519.9 | 338.4 | 479.8 | 532.1 | 590.2 | 654.6 |
| WACC, % | 11.23 | 16.04 | 15.83 | 15.89 | 15.91 | 14.98 | 14.98 | 14.98 | 14.98 | 14.98 |
| PV UFCF | ||||||||||
| SUM PV UFCF | 1,670.5 | |||||||||
| Long Term Growth Rate, % | 2.00 | |||||||||
| Free cash flow (T + 1) | 668 | |||||||||
| Terminal Value | 5,143 | |||||||||
| Present Terminal Value | 2,559 | |||||||||
| Enterprise Value | 4,229 | |||||||||
| Net Debt | -547 | |||||||||
| Equity Value | 4,776 | |||||||||
| Diluted Shares Outstanding, MM | 87 | |||||||||
| Equity Value Per Share | 55.12 |
What You Will Get
- Real HWC Financial Data: Pre-filled with Hancock Whitney Corporation’s historical and projected data for precise analysis.
- Fully Editable Template: Modify key inputs like revenue growth, WACC, and EBITDA % with ease.
- Automatic Calculations: See Hancock Whitney Corporation’s intrinsic value update instantly based on your changes.
- Professional Valuation Tool: Designed for investors, analysts, and consultants seeking accurate DCF results.
- User-Friendly Design: Simple structure and clear instructions for all experience levels.
Key Features
- Customizable Financial Inputs: Adjust essential metrics such as loan growth, interest income, and operating expenses.
- Instant DCF Valuation: Quickly computes intrinsic value, NPV, and other financial metrics.
- High-Precision Accuracy: Leverages Hancock Whitney Corporation’s (HWC) actual financial data for reliable valuation results.
- Effortless Scenario Testing: Easily evaluate various assumptions and analyze their impacts.
- Efficiency Booster: Remove the hassle of constructing intricate valuation models from the ground up.
How It Works
- Step 1: Download the Excel file.
- Step 2: Review pre-entered Hancock Whitney Corporation (HWC) data (historical and projected).
- Step 3: Adjust key assumptions (yellow cells) based on your analysis.
- Step 4: View automatic recalculations for Hancock Whitney Corporation's (HWC) intrinsic value.
- Step 5: Use the outputs for investment decisions or reporting.
Why Choose This Calculator for Hancock Whitney Corporation (HWC)?
- Precise Information: Utilize real Hancock Whitney financial data for trustworthy valuation outcomes.
- Flexible Options: Modify essential variables like growth rates, WACC, and tax rates to align with your forecasts.
- Efficiency Boost: Ready-made calculations save you the hassle of starting from the ground up.
- Expert-Level Tool: Tailored for investors, analysts, and financial consultants.
- Easy to Use: User-friendly design and straightforward instructions ensure accessibility for all users.
Who Should Use This Product?
- Individual Investors: Make informed decisions about buying or selling Hancock Whitney Corporation (HWC) stock.
- Financial Analysts: Streamline valuation processes with ready-to-use financial models for Hancock Whitney Corporation (HWC).
- Consultants: Deliver professional valuation insights on Hancock Whitney Corporation (HWC) to clients quickly and accurately.
- Business Owners: Understand how companies like Hancock Whitney Corporation (HWC) are valued to guide your own strategy.
- Finance Students: Learn valuation techniques using real-world data and scenarios related to Hancock Whitney Corporation (HWC).
What the Hancock Whitney Template Contains
- Comprehensive DCF Model: Editable template featuring detailed valuation calculations tailored for Hancock Whitney Corporation (HWC).
- Real-World Data: Historical and projected financials for Hancock Whitney preloaded for in-depth analysis.
- Customizable Parameters: Modify WACC, growth rates, and tax assumptions to explore various scenarios.
- Financial Statements: Complete annual and quarterly breakdowns for enhanced insights into performance.
- Key Ratios: Integrated analysis for profitability, efficiency, and leverage specific to Hancock Whitney.
- Dashboard with Visual Outputs: Engaging charts and tables to present clear, actionable results.
Disclaimer
All information, articles, and product details provided on this website are for general informational and educational purposes only. We do not claim any ownership over, nor do we intend to infringe upon, any trademarks, copyrights, logos, brand names, or other intellectual property mentioned or depicted on this site. Such intellectual property remains the property of its respective owners, and any references here are made solely for identification or informational purposes, without implying any affiliation, endorsement, or partnership.
We make no representations or warranties, express or implied, regarding the accuracy, completeness, or suitability of any content or products presented. Nothing on this website should be construed as legal, tax, investment, financial, medical, or other professional advice. In addition, no part of this site—including articles or product references—constitutes a solicitation, recommendation, endorsement, advertisement, or offer to buy or sell any securities, franchises, or other financial instruments, particularly in jurisdictions where such activity would be unlawful.
All content is of a general nature and may not address the specific circumstances of any individual or entity. It is not a substitute for professional advice or services. Any actions you take based on the information provided here are strictly at your own risk. You accept full responsibility for any decisions or outcomes arising from your use of this website and agree to release us from any liability in connection with your use of, or reliance upon, the content or products found herein.