
|
InterContinental Hotels Group PLC (IHG): 5 FORCES Analysis [Nov-2025 Updated] |
Fully Editable: Tailor To Your Needs In Excel Or Sheets
Professional Design: Trusted, Industry-Standard Templates
Investor-Approved Valuation Models
MAC/PC Compatible, Fully Unlocked
No Expertise Is Needed; Easy To Follow
InterContinental Hotels Group PLC (IHG) Bundle
You're looking at InterContinental Hotels Group PLC, and honestly, the picture is complex. As of late 2025, this giant manages a 999k room system, banking a healthy 64.7% fee margin, but that scale doesn't mean the game is easy. With over 145 million loyalty members driving 65% of H1 2025 room nights, they have a moat, yet they're still wrestling with fierce rivals like Marriott and the ever-present threat from short-term rentals. Below, we break down exactly where the pressure points are-from supplier leverage to customer power-using the Five Forces framework to map out the real risks and opportunities you need to know about right now.
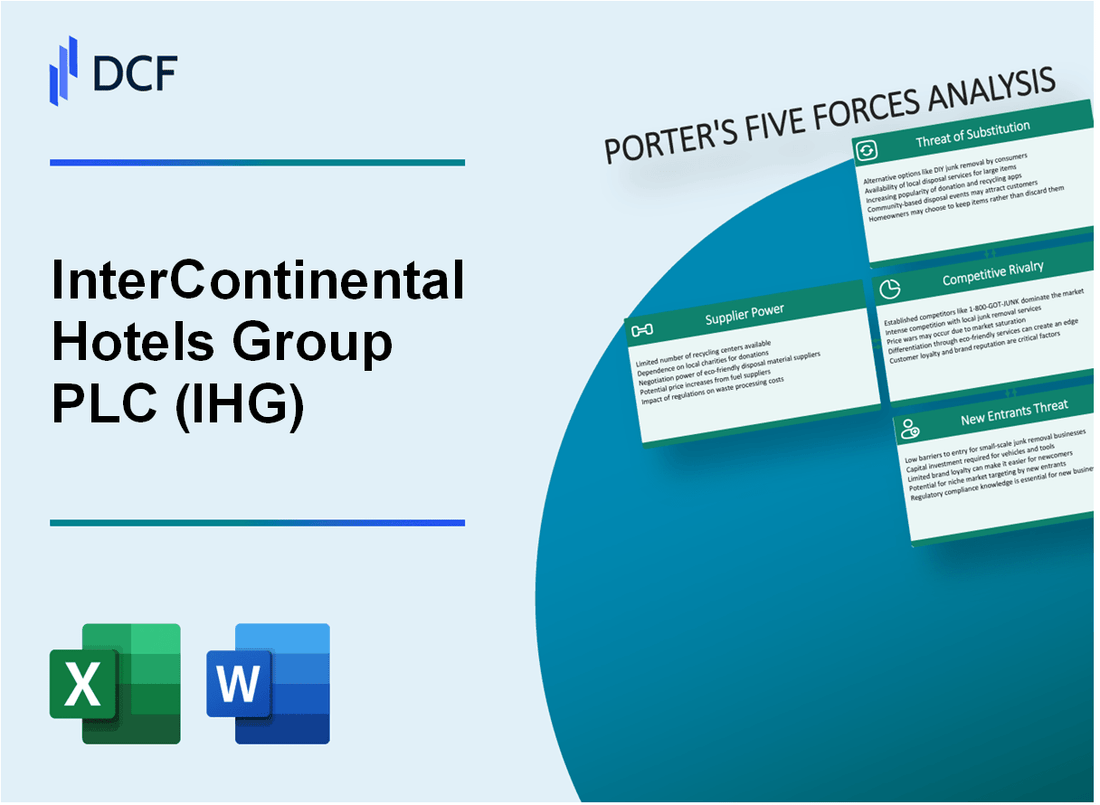
InterContinental Hotels Group PLC (IHG) - Porter's Five Forces: Bargaining power of suppliers
When you look at InterContinental Hotels Group PLC (IHG) from the supplier's side, you see a mixed bag of leverage points. It's not a simple case of suppliers having all the cards or IHG holding all the aces; it really depends on what you're buying.
Labor Supply and Wage Power
The market for skilled hospitality staff is definitely tight, and that gives employees more say in their compensation. We've seen reports noting the general cost pressures from rising labor expenses impacting the sector as of late 2024 and into 2025. To give you a concrete look at the scale of payroll involved, InterContinental Hotels Group PLC's reimbursable revenues, which predominantly cover payroll costs at managed properties where IHG is the employer, increased by $151m, representing a 6.1% jump, to reach $2,611m for the year ending December 31, 2024. That's a significant flow of funds tied to labor. If onboarding takes 14+ days, churn risk rises, which only exacerbates this wage power dynamic for skilled roles.
Core Technology Providers
Suppliers providing core technology-think Property Management Systems (PMS) and booking engines-hold substantial power. Switching these systems is a major undertaking, meaning the switching costs for InterContinental Hotels Group PLC are quite high. You're not just changing software; you're touching the operational heart of thousands of properties. For instance, InterContinental Hotels Group PLC expected to have around 1,500 hotels running on the HotelKey PMS by the end of 2025, with another 2,000 slated for 2026. That level of enterprise-wide deployment locks in the supplier relationship for the medium term, giving that technology vendor considerable leverage in contract negotiations.
Procurement Scale and Leverage
To counter supplier power, InterContinental Hotels Group PLC leans hard on its massive scale. Leveraging the size of its global estate-which surpassed 6,600 open hotels at the end of 2024-allows the procurement team to negotiate favorable terms. The centralized procurement framework helps secure tangible cost efficiencies, especially for franchisees. For example, participating properties in the UK & Ireland program have reported average savings of up to 15% on food and beverage (F&B) products, with some seeing approximately 13% savings on selected F&B items. This scale is a key defense mechanism against broad inflation.
Here's a quick look at the scale of the procurement program in the UK & Ireland:
| Metric | Data Point |
|---|---|
| Reported Average F&B Savings (UK&I) | Up to 15% |
| Reported Average F&B Savings (Selected Items) | Approximately 13% |
| Number of Suppliers in UK&I Program | Over 100 |
| Total Vetted Suppliers Globally | Over 200 |
| UK&I Program Hotel Participation (as of early 2025) | Over 140 hotels |
Sustainability Mandates and Niche Suppliers
The increasing corporate focus on sustainability, driven by stakeholder expectations, shifts power toward niche providers offering eco-friendly products. InterContinental Hotels Group PLC is actively promoting responsible sourcing, evidenced by its role as a founding member of The Hospitality Alliance for Responsible Procurement (HARP). This focus means suppliers who can meet these criteria gain entry to InterContinental Hotels Group PLC's approved network. You can see this trend in action:
- More than 340 hotels had third-party sustainability certification by the end of 2024.
- Over 65% of corporate accounts now include ESG-related questions in their RFPs.
- Greater China updated brand standards in 2025 for amenities made from post-consumer recycled plastic.
- InterContinental Hotels Group PLC is exploring on-site renewable options like solar panels in mature markets.
Suppliers who align with the 'Journey to Tomorrow' strategy become more valuable, effectively increasing their bargaining power within the specific, growing segment of sustainable goods and services.
InterContinental Hotels Group PLC (IHG) - Porter's Five Forces: Bargaining power of customers
The bargaining power of customers for InterContinental Hotels Group PLC (IHG) remains a significant force, primarily driven by the transparency of the digital marketplace. You see this pressure most clearly in the ease with which a potential guest can compare rates across various Online Travel Agencies (OTAs) like Expedia or Booking.com against IHG's direct channels.
This price shopping capability inherently raises customer leverage, as the perceived cost of switching between IHG properties or even competing hotel chains is low for non-loyalty customers. However, InterContinental Hotels Group PLC (IHG) has built a substantial moat against this commoditization through its loyalty ecosystem. The IHG One Rewards program is a key strategic asset in managing buyer power. As of the latest available data, the program boasts 145 million members.
The success of this direct relationship is evident in booking behavior. Member penetration-the share of room nights booked by loyalty members-is a critical metric that shifts power back to InterContinental Hotels Group PLC (IHG). While the exact figure for H1 2025 is proprietary, prior reporting indicated that member penetration globally exceeds 60% of room nights. This high penetration drives bookings through direct channels, which is significantly more cost-effective for the company and its hotel owners.
The financial benefit of this direct relationship directly counters OTA leverage. Here's a quick math on the value differential, based on recent industry analysis:
| Metric | IHG One Rewards Member | Typical OTA Guest |
|---|---|---|
| Average Spend Per Booking | 10% more than OTA guest | Baseline |
| Booking Cost to Hotel (Fees/Marketing) | Approximately 50% lower than OTA guest | Baseline |
| Profitability to Hotel Owner | Roughly 20% more profitable | Baseline |
This data shows that when customers engage directly through the loyalty program, their power to demand lower prices via third parties is diminished because the value proposition of direct booking is superior for the hotel operator. Still, the power of large-scale buyers cannot be ignored.
Corporate and group travel buyers possess distinct leverage that must be managed separately from the transient leisure segment. These buyers negotiate contracts for significant, predictable volume, which allows them to command substantial discounts off published rates. This negotiation power is a constant factor in InterContinental Hotels Group PLC (IHG)'s revenue management strategy.
- Corporate buyers secure volume discounts.
- Group bookings require negotiated rate structures.
- Leisure demand was flat in the Americas in H1 2025.
- Business rooms revenue grew +3% in the Americas in H1 2025.
To keep these high-volume customers engaged without eroding margin excessively, InterContinental Hotels Group PLC (IHG) offers specialized programs like IHG Business Rewards, which provide tiered incentives and points accumulation, effectively turning a negotiation point into a loyalty driver. The ability to segment demand by customer type-loyalty member, corporate negotiated, and transient OTA-is how InterContinental Hotels Group PLC (IHG) manages this multifaceted customer power.
InterContinental Hotels Group PLC (IHG) - Porter's Five Forces: Competitive rivalry
Rivalry within the hospitality sector for InterContinental Hotels Group PLC (IHG) is defintely intense, given the global scale of competitors like Marriott International, Hilton Worldwide Holdings, and Hyatt Hotels Corporation. You're looking at a market where brand recognition and loyalty program penetration are paramount to capturing share.
InterContinental Hotels Group PLC (IHG)'s performance in the Americas during the first quarter of 2025 demonstrated strong competitive traction, with Americas Revenue Per Available Room (RevPAR) growing by 3.5% year-over-year. This performance was ahead of the full-year 2024 growth rate for the region, which was 2.5%. Globally, the company posted a 3.3% increase in RevPAR for Q1 2025, showing resilience despite volatility in some markets like Greater China, which saw a -3.5% RevPAR decline.
The company's strategy to combat this rivalry rests heavily on its expansive and tiered brand offering. InterContinental Hotels Group PLC (IHG)'s diverse portfolio currently comprises 19 distinct brands, which allows it to compete across the Luxury & Lifestyle, Premium, Essentials, and Suites chain scales. This breadth helps capture demand from various traveler segments, from extended-stay guests to luxury leisure travelers.
Even with an asset-light operational model, which shifts significant capital expenditure risk to franchisees, the drive for occupancy remains a fierce battleground. This structure means that while fixed costs are lower on the balance sheet, the pressure to maintain high utilization rates across the vast system is constant, often leading to aggressive pricing actions to fill rooms. For instance, in Q1 2025, global occupancy only increased by 0.6 percentage points, while the Average Daily Rate (ADR) grew by 2.2%.
Here is a snapshot of InterContinental Hotels Group PLC (IHG)'s operational scale and growth momentum as of the end of Q1 2025:
| Metric | Value (Q1 2025) | Context |
|---|---|---|
| Global RevPAR Growth | +3.3% | Year-over-year performance |
| Americas RevPAR Growth | +3.5% | Led by continued U.S. growth |
| Global System Size (Hotels) | 6,668 | Total open hotels |
| Global System Size (Rooms) | 987,000 | Total open rooms |
| Rooms Signed in Q1 | 25,800 | Up from 17,700 in Q1 2024 (excluding Ruby acquisition) |
| Global Pipeline (Hotels) | 2,265 | Year-over-year pipeline growth of 9.4% |
The competitive positioning is reinforced by development activity, which is a key indicator of owner confidence against rivals:
- Opened 14,600 rooms in Q1 2025, more than double the prior year period.
- Conversions represented 60% of room openings in the quarter.
- The company completed $324 million of its planned $900 million share buyback program for 2025.
- The U.S. segment saw group bookings rise by 5% and business travel revenue increase by 3% in Q1 2025.
- The pipeline for the Americas represents 20% of the current U.S. system size.
InterContinental Hotels Group PLC (IHG) - Porter's Five Forces: Threat of substitutes
You're looking at how easily travelers can choose something other than an InterContinental Hotels Group PLC (IHG) branded hotel, and honestly, the substitutes are a major factor right now. Short-term vacation rentals, primarily through platforms like Airbnb, present a substantial alternative, particularly for leisure trips and longer stays where home-like amenities matter.
The sheer scale of the competition is stark. As of late 2025, Airbnb boasts 8.1 million listings globally, dwarfing the 187,000 hotels worldwide. This massive supply base puts pressure on pricing across the board. For instance, in the U.S. market, the average nightly rate for an Airbnb stay was around $137/night, noticeably cheaper than the hotel industry average of $167/night. This pricing difference is a clear driver for substitution, especially when you see that IHG's own leisure travel demand fell by 2% year-on-year in Q3 2025.
It's not just the big player, either. Serviced apartments and independent boutique hotels offer viable, often lower-cost options. To be fair, the entire traditional hotel sector is feeling the pinch from these alternatives; the industry's real Revenue Per Available Room (RevPAR) is estimated to be 10.9% below 2019 levels after accounting for inflation over the past five years. This suggests that even when hotels raise nominal rates, the value proposition against substitutes is eroding.
Switching costs for the customer are minimal because of the digital booking ecosystem. You can compare and book an alternative lodging option in minutes, so the friction to switch is low. This ease of movement directly impacts IHG's ability to maintain pricing power, as evidenced by the global Average Daily Rate (ADR) for IHG easing by 0.4% in Q3 2025.
Here's a quick math comparison showing where the pressure points are:
| Metric | Short-Term Rentals (STRs - U.S. Focus) | Hotels (U.S. Industry Average) |
|---|---|---|
| Global Listings/Properties (2025) | 8.1 million listings (Airbnb) | 187,000 properties globally |
| Average Daily Rate (ADR) (2025) | $137/night (Average STR) | $167/night (Average Hotel) |
| Q2 2025 RevPAR Comparison | Roughly 9 percentage points higher than hotels | Slower growth, projected near-zero growth in 2025 |
| U.S. Market Share (STRs) | 43% (Airbnb dominance) | N/A (Hotels hold the remainder) |
InterContinental Hotels Group PLC (IHG) counters this threat by aggressively pushing brands suited for the segments where STRs are strongest, particularly extended-stay and midscale conversions. You see this focus in their development strategy. Conversions accounted for about 40% of IHG's signings in Q1 2025, showing a clear move to quickly rebrand existing, non-chain properties.
The Garner brand is central to this defense. It's designed specifically for the midscale conversion space, offering quality fundamentals at an affordable price point. Check out the current footprint for Garner as of September 30, 2025:
- Open Hotels: 72
- Open Rooms: 6,900
- Pipeline Hotels: 80
- Pipeline Rooms: 7,050
This pipeline growth is significant, as Garner aims to reach 500 hotels in 10 years and 1,000 locations within 20 years. Also, IHG's overall global pipeline stood at 2,316 hotels as of Q3 2025, showing that brand expansion is the primary lever against substitution.
InterContinental Hotels Group PLC (IHG) - Porter's Five Forces: Threat of new entrants
You're looking at the barriers a new hotel operator faces when trying to break into the market dominated by InterContinental Hotels Group PLC (IHG). Honestly, the hurdles are significant, especially when you consider the sheer scale and financial muscle of an established player like InterContinental Hotels Group PLC (IHG).
High capital investment and securing prime real estate are substantial barriers to entry. For instance, in the U.S. market, as of the first half of 2025, developing a full-service urban hotel was estimated to be 71% more expensive than acquiring an existing one, a clear sign of high construction and land acquisition costs. Furthermore, new hotel supply growth has been slow; U.S. annual supply growth was only 1.2% in 2024, with forecasts around 1.5% for 2025. This limited new supply in prime urban cores, where InterContinental Hotels Group PLC (IHG) already has a strong presence, makes it tough for newcomers to find viable, high-return locations. The broader industry is seeing JLL project 15-25% growth in global hotel investment volume, suggesting capital is flowing, but often toward existing assets or specific segments, not necessarily funding entirely new ground-up competitors at scale.
InterContinental Hotels Group PLC (IHG)'s massive development pipeline acts as a powerful deterrent for new developers. As of September 30, 2025, InterContinental Hotels Group PLC (IHG)'s global pipeline stood at 342k rooms across 2,316 hotels, representing a year-over-year growth of 4.7%. Even looking at the mid-year figure, the pipeline was 338k rooms, which was equivalent to 34% of the existing system size at that time. This forward-looking inventory signals to potential developers that InterContinental Hotels Group PLC (IHG) is aggressively securing future growth, effectively pre-booking prime development slots and making it harder for a new brand to establish a competitive footprint quickly.
Established brand equity and the defintely massive loyalty program create high customer switching costs. InterContinental Hotels Group PLC (IHG) manages a portfolio of 20 global hotel brands, spanning from luxury like Six Senses to essentials like Holiday Inn Express. The loyalty engine, IHG One Rewards, is a major moat, boasting over 145 million members. Customers heavily invested in this ecosystem-earning status like Diamond Elite, which offers a 100% points bonus-face a real cost in time and lost benefits if they switch to a competitor's program. This stickiness locks in a significant portion of the demand base.
New, tech-enabled entrants often target niche markets, bypassing traditional hotel barriers. These disruptors frequently focus on asset-light models or specific traveler needs that InterContinental Hotels Group PLC (IHG)'s broader portfolio might not perfectly serve, such as hyper-local boutique experiences or extended-stay models that leverage new booking technology. InterContinental Hotels Group PLC (IHG) is aware, evidenced by its own brand expansion, such as the acquisition of the Ruby urban lifestyle brand, which has a pipeline of projects under construction, including the 237 room Ruby Marseille set to open in late 2025. Still, smaller, digitally native competitors can gain traction by focusing capital and marketing spend on underserved micro-segments.
Here's a quick look at the scale InterContinental Hotels Group PLC (IHG) brings to the table as of late 2025:
| Metric | Value (Latest Reported 2025 Data) |
| Global Open Rooms (as of June 30, 2025) | 999k rooms |
| Global Open Hotels (as of June 30, 2025) | 6,760 hotels |
| Global Pipeline Rooms (as of Sept 30, 2025) | 342k rooms |
| Global Pipeline Hotels (as of Sept 30, 2025) | 2,316 hotels |
| IHG One Rewards Members | Over 145 million |
| Total IHG Brands | 20 |
The threat from new entrants is tempered by these structural advantages, but you must watch for agile, niche players.
- High cost to acquire prime urban real estate.
- Development cost premium: 71% higher for urban hotels (H1 2025).
- Massive pipeline: 342k rooms committed for future growth.
- Loyalty base: Over 145 million members locked in.
- Brand diversity across 20 distinct brands.
Finance: draft 13-week cash view by Friday.
Disclaimer
All information, articles, and product details provided on this website are for general informational and educational purposes only. We do not claim any ownership over, nor do we intend to infringe upon, any trademarks, copyrights, logos, brand names, or other intellectual property mentioned or depicted on this site. Such intellectual property remains the property of its respective owners, and any references here are made solely for identification or informational purposes, without implying any affiliation, endorsement, or partnership.
We make no representations or warranties, express or implied, regarding the accuracy, completeness, or suitability of any content or products presented. Nothing on this website should be construed as legal, tax, investment, financial, medical, or other professional advice. In addition, no part of this site—including articles or product references—constitutes a solicitation, recommendation, endorsement, advertisement, or offer to buy or sell any securities, franchises, or other financial instruments, particularly in jurisdictions where such activity would be unlawful.
All content is of a general nature and may not address the specific circumstances of any individual or entity. It is not a substitute for professional advice or services. Any actions you take based on the information provided here are strictly at your own risk. You accept full responsibility for any decisions or outcomes arising from your use of this website and agree to release us from any liability in connection with your use of, or reliance upon, the content or products found herein.