
|
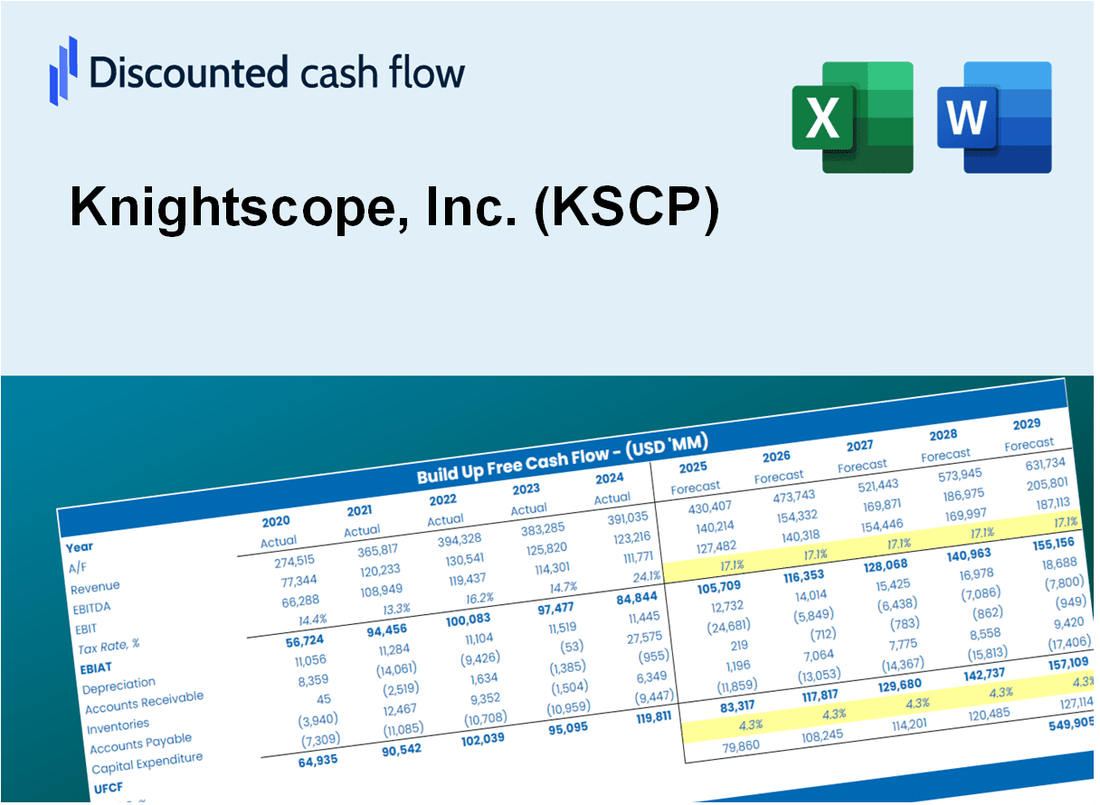
Knightscope, Inc. (KSCP) DCF Valuation |
Fully Editable: Tailor To Your Needs In Excel Or Sheets
Professional Design: Trusted, Industry-Standard Templates
Investor-Approved Valuation Models
MAC/PC Compatible, Fully Unlocked
No Expertise Is Needed; Easy To Follow
Knightscope, Inc. (KSCP) Bundle
Explore Knightscope, Inc.'s (KSCP) financial potential with our user-friendly DCF Calculator! Enter your projections for growth, margins, and expenses to determine Knightscope, Inc.'s (KSCP) intrinsic value and shape your investment approach.
What You Will Get
- Real KSCP Financial Data: Pre-filled with Knightscope’s historical and projected data for precise analysis.
- Fully Editable Template: Modify key inputs like revenue growth, WACC, and EBITDA % with ease.
- Automatic Calculations: See Knightscope’s intrinsic value update instantly based on your changes.
- Professional Valuation Tool: Designed for investors, analysts, and consultants seeking accurate DCF results.
- User-Friendly Design: Simple structure and clear instructions for all experience levels.
Key Features
- 🔍 Real-Life KSCP Financials: Pre-filled historical and projected data for Knightscope, Inc.
- ✏️ Fully Customizable Inputs: Adjust all critical parameters (yellow cells) like WACC, growth %, and tax rates.
- 📊 Professional DCF Valuation: Built-in formulas calculate Knightscope’s intrinsic value using the Discounted Cash Flow method.
- ⚡ Instant Results: Visualize Knightscope’s valuation instantly after making changes.
- Scenario Analysis: Test and compare outcomes for various financial assumptions side-by-side.
How It Works
- Step 1: Download the Excel file for Knightscope, Inc. (KSCP).
- Step 2: Review Knightscope’s pre-filled financial data and forecasts.
- Step 3: Modify key inputs such as revenue growth, WACC, and tax rates (highlighted cells).
- Step 4: Observe the DCF model update in real-time as you adjust assumptions.
- Step 5: Analyze the outputs and utilize the results for your investment decisions.
Why Choose This Calculator for Knightscope, Inc. (KSCP)?
- Accuracy: Utilizes real Knightscope financials to ensure precise data.
- Flexibility: Tailored for users to easily test and adjust inputs as needed.
- Time-Saving: Eliminate the complexity of constructing a DCF model from the ground up.
- Professional-Grade: Crafted with the precision and usability expected at the CFO level.
- User-Friendly: Intuitive design makes it accessible for users without extensive financial modeling skills.
Who Should Use This Product?
- Investors: Accurately assess Knightscope, Inc.'s (KSCP) fair value prior to making investment choices.
- CFOs: Utilize a high-quality DCF model for financial reporting and analysis specific to Knightscope, Inc. (KSCP).
- Consultants: Efficiently customize the template for valuation reports tailored to Knightscope, Inc. (KSCP) clients.
- Entrepreneurs: Acquire knowledge on financial modeling practices employed by industry leaders like Knightscope, Inc. (KSCP).
- Educators: Implement it as a teaching resource to illustrate valuation techniques relevant to Knightscope, Inc. (KSCP).
What the Template Contains
- Comprehensive DCF Model: Editable template featuring detailed valuation calculations tailored for Knightscope, Inc. (KSCP).
- Real-World Data: Knightscope’s historical and projected financials preloaded for thorough analysis.
- Customizable Parameters: Modify WACC, growth rates, and tax assumptions to explore various scenarios.
- Financial Statements: Complete annual and quarterly breakdowns to gain deeper insights into performance.
- Key Ratios: Integrated analysis for assessing profitability, efficiency, and leverage.
- Dashboard with Visual Outputs: Charts and tables designed for clear, actionable results specific to Knightscope, Inc. (KSCP).
Disclaimer
All information, articles, and product details provided on this website are for general informational and educational purposes only. We do not claim any ownership over, nor do we intend to infringe upon, any trademarks, copyrights, logos, brand names, or other intellectual property mentioned or depicted on this site. Such intellectual property remains the property of its respective owners, and any references here are made solely for identification or informational purposes, without implying any affiliation, endorsement, or partnership.
We make no representations or warranties, express or implied, regarding the accuracy, completeness, or suitability of any content or products presented. Nothing on this website should be construed as legal, tax, investment, financial, medical, or other professional advice. In addition, no part of this site—including articles or product references—constitutes a solicitation, recommendation, endorsement, advertisement, or offer to buy or sell any securities, franchises, or other financial instruments, particularly in jurisdictions where such activity would be unlawful.
All content is of a general nature and may not address the specific circumstances of any individual or entity. It is not a substitute for professional advice or services. Any actions you take based on the information provided here are strictly at your own risk. You accept full responsibility for any decisions or outcomes arising from your use of this website and agree to release us from any liability in connection with your use of, or reliance upon, the content or products found herein.