
|
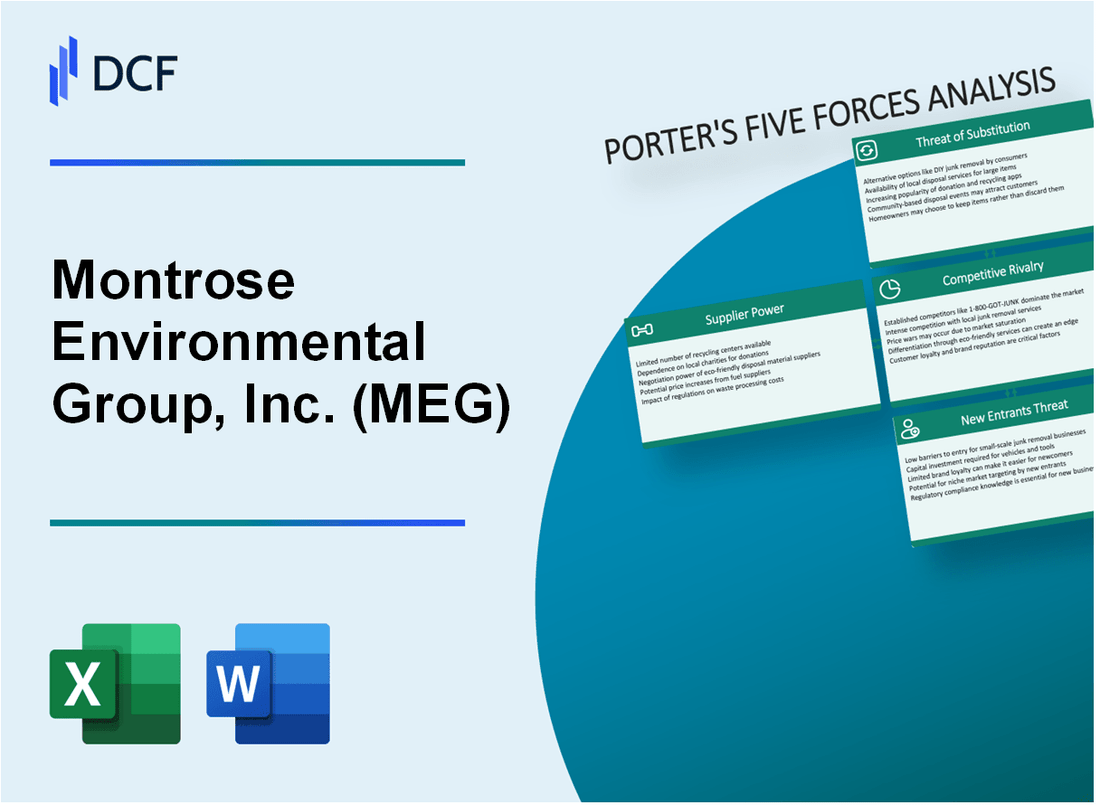
Montrose Environmental Group, Inc. (MEG): 5 FORCES Analysis [Nov-2025 Updated] |
Fully Editable: Tailor To Your Needs In Excel Or Sheets
Professional Design: Trusted, Industry-Standard Templates
Investor-Approved Valuation Models
MAC/PC Compatible, Fully Unlocked
No Expertise Is Needed; Easy To Follow
Montrose Environmental Group, Inc. (MEG) Bundle
You're looking for a clear-eyed view of Montrose Environmental Group's competitive position as we head into 2026, so I've distilled the market dynamics using Porter's Five Forces as of late 2025. Honestly, while the need for specialized scientists gives suppliers leverage, the company's massive footprint-think that $1.5 billion US Air Force MATOC-keeps customer power moderate, even as they posted $234.5 million in Q2 revenue. We'll see how high regulatory barriers help defend against new entrants, all while Montrose fights for share in the $46.50 billion industry to hit that $112.0 million to $118.0 million Adjusted EBITDA guidance. Keep reading to see the precise pressure points shaping their strategy right now.
Montrose Environmental Group, Inc. (MEG) - Porter's Five Forces: Bargaining power of suppliers
You're assessing Montrose Environmental Group, Inc.'s (MEG) supplier power, which is heavily weighted by the scarcity and cost of its human capital. Honestly, the talent pool is the biggest lever suppliers have here.
Specialized environmental scientists and engineers command high wages, which directly impacts MEG's operating costs. For instance, as of late 2025, the national average annual pay for an Environmental Engineer is approximately $91,191, but the 75th percentile for these roles pushes toward $108,500. This high floor for specialized expertise means that individual experts or small, specialized teams have significant leverage when negotiating compensation or contract rates with Montrose Environmental Group, Inc. (MEG).
Here's a quick look at what you're seeing in the market for key roles influencing MEG's cost structure:
| Role Category | Average Annual Salary (Late 2025, US) | 75th Percentile Salary (Late 2025, US) |
| Environmental Engineer | $91,191 | $108,500 |
| Environmental Scientist | $88,009 | $94,822 |
| Environmental Engineer Scientist | $84,123 | $98,500 |
Proprietary technology providers for PFAS treatment hold significant leverage, too. Given the tightening regulatory environment-with US EPA limits as low as 4 ppt for PFOA and PFOS-clients need proven, high-performance solutions. Suppliers offering technologies capable of concentrating PFAS residuals up to 100,000x, as some advanced systems claim, dictate terms because their technology is critical for compliance in a market segment valued at USD 2.28 billion in 2025.
Montrose Environmental Group, Inc. (MEG) has historically countered this reliance on external talent and capability through aggressive mergers and acquisitions. While the outline suggested a reliance on over 64 deals, public data as of September 2025 shows Montrose Environmental Group, Inc. (MEG) has completed a total of 26 acquisitions. This strategy is designed to internalize talent and capability, reducing the external supplier power dynamic. For example, the first six months of 2025 saw $22.5 million in revenue contribution from acquisitions, showing this remains a core growth and capability-building lever.
The power dynamic shifts when looking at commodity inputs. Instrument and lab equipment vendors are generally fragmented, limiting their power over Montrose Environmental Group, Inc. (MEG). However, this fragmentation doesn't mean costs are low, just that no single vendor can hold the entire company hostage. The key supplier risks remain concentrated in two areas:
- Highly specialized, non-acquirable scientific expertise.
- Niche, patented treatment technology essential for high-margin services.
For you, the takeaway is that managing supplier power isn't about negotiating down the price of a standard beaker; it's about retaining the top $105,000+ earners and securing exclusive access to the best PFAS destruction IP. Finance: draft the 2026 compensation budget factoring in a 7% increase for senior technical staff by Friday.
Montrose Environmental Group, Inc. (MEG) - Porter's Five Forces: Bargaining power of customers
You're looking at the customer side of the equation for Montrose Environmental Group, Inc. (MEG), and honestly, the power dynamic here is a mix of strong anchors and mitigating factors. The customer base is quite broad, which is a good buffer against any single client holding too much sway over pricing or terms.
We see this diversity across major sectors. Montrose Environmental Group, Inc. serves clients in government, energy, and real estate, among others. For instance, the company's Assessment, Permitting & Response (AP&R) segment saw revenue jump to $103.9 million in Q2 2025, partly driven by a significant environmental emergency response for a major energy client. This shows deep penetration in the private sector, balancing out the public work.
The presence of large, long-term government contracts definitely tips the scales toward the buyer in those specific instances. Montrose Environmental Group, Inc. was selected by the United States Air Force as one of the top environmental firms for the Multiple Award Task Order Contract (MATOC). This is a massive, $1.5 billion contract spanning a decade, covering environmental remediation and planning at Air Force installations worldwide. While Montrose Environmental Group, Inc. will receive a portion of that total value, securing a spot on a contract of that magnitude gives that specific buyer significant leverage over the scope and execution of those task orders.
Here's a quick look at the scale of the business and that key government award:
| Metric | Value/Detail |
| Q2 2025 Revenue | $234.5 million |
| US Air Force MATOC Value | $1.5 billion (Total Contract Value) |
| US Air Force MATOC Term | Over the next decade |
| H1 2025 Operating Cash Flow Improvement | $48.5 million |
Still, customers face only moderate switching costs when dealing with Montrose Environmental Group, Inc. Switching is tough because the work involves complex, often site-specific regulatory compliance and project continuity is crucial, especially for remediation or long-term monitoring. If you rip out an environmental monitoring system or stop a remediation phase, you face regulatory risk. However, the environmental services industry is fragmented, meaning alternatives exist, which keeps the power from being entirely one-sided.
To be fair, the demand side itself works in Montrose Environmental Group, Inc.'s favor, which tempers buyer power. Much of the demand is non-discretionary; it's driven by mandates from agencies like the EPA or state regulators, not by a client's optional spending budget. When a client needs to comply with PFAS regulations or address an emergency spill, price sensitivity takes a back seat to compliance and speed. This regulatory underpinning reduces the customer's ability to push aggressively on price for essential services.
The revenue scale itself suggests no single customer dominates the overall revenue stream for Montrose Environmental Group, Inc. The Q2 2025 revenue hit $234.5 million, and the full-year 2025 revenue guidance is projected to be between $795.0 million and $835.0 million. This scale implies a wide base of clients.
The key factors influencing customer bargaining power include:
- Diverse customer base spanning government, energy, and real estate.
- Large, multi-year government contracts like the $1.5 billion MATOC.
- Moderate switching costs due to regulatory complexity.
- Non-discretionary demand driven by environmental regulation.
- Q2 2025 revenue of $234.5 million showing broad revenue base.
Montrose Environmental Group, Inc. (MEG) - Porter's Five Forces: Competitive rivalry
You're looking at a sector where scale matters, and Montrose Environmental Group, Inc. (MEG) is definitely playing in the deep end against some giants. The competitive rivalry here isn't just about who can do the job; it's about who can do the most jobs, end-to-end. The market is moderately fragmented, but you see the heavyweights like AECOM and Tetra Tech setting the pace with their integrated offerings. Still, Montrose Environmental Group, Inc. (MEG) is carving out serious space, partly by using a strategy of M&A and cross-selling to absorb or outmaneuver smaller, niche firms. That aggressive tuck-in strategy ramps up the pressure on everyone else trying to hold onto specialized contracts.
The overall environment is one of strong growth, which helps keep the competitive fires stoked but also means there's more revenue to fight over. The US environmental consulting market is estimated to hit $46.50 billion in 2025. That's a big pie, but the competition for slices is intense, focusing on who has the deepest bench of technical expertise, the most current regulatory knowledge, and the ability to offer integrated service offerings-from initial assessment right through to remediation.
Here's a quick look at how Montrose Environmental Group, Inc. (MEG)'s performance metrics stack up, which is a key indicator of its competitive strength against rivals:
| Metric | Value (Latest Available Data/Guidance) | Context |
|---|---|---|
| FY 2025 Consolidated Adjusted EBITDA Guidance Range | $112.0 million to $118.0 million | Shows strong expected performance against rivals. |
| FY 2025 Revenue Guidance Range | $810.0 million to $830.0 million | Indicates significant scale in the market. |
| Q3 2025 Consolidated Adjusted EBITDA | $33.7 million | Recent quarterly operational strength. |
| Consolidated Adjusted EBITDA as % of Revenue (9 Months 2025) | 14.5% | Margin performance relative to competitors. |
| Leverage Ratio (as of September 30, 2025) | 2.7x | Financial flexibility for continued M&A activity. |
The competition is definitely based on capability. You can't just show up with a clipboard; you need demonstrable success in complex areas like PFAS treatment or advanced air monitoring. Montrose Environmental Group, Inc. (MEG)'s ability to deliver on its promises, evidenced by its increased guidance, is what keeps it relevant when bidding against firms with broader engineering backgrounds. For instance, the company's expected 20% Consolidated Adjusted EBITDA growth for FY2025 over FY2024 shows operating leverage that rivals need to match.
The M&A strategy directly impacts rivalry by consolidating expertise and client bases. You see this play out in the numbers:
- Contributions from acquisitions added $22.5 million to revenue in the first six months of 2025.
- Organic revenue growth in the first six months of 2025 totaled $28.4 million.
- Incremental revenue from environmental emergency responses was $33.8 million in the first six months of 2025.
This mix of growth drivers-organic strength, emergency response volatility, and acquisition integration-means Montrose Environmental Group, Inc. (MEG) is competing on multiple fronts simultaneously. If onboarding new acquisitions takes too long, churn risk rises, but the financial results suggest they are integrating effectively, which is a competitive advantage.
Montrose Environmental Group, Inc. (MEG) - Porter's Five Forces: Threat of substitutes
When you look at the threat of substitutes for Montrose Environmental Group, Inc. (MEG), you're really looking at what clients can do internally or use instead of paying for MEG's specialized, accredited services. Honestly, the barrier to substitution is often regulatory necessity, but the temptation to keep work in-house is always there.
In-house environmental, health, and safety (EHS) teams are a primary substitute for consulting services. For routine compliance checks or internal audits, a large industrial client might decide to use their own staff rather than outsourcing. To give you some scale, the global environmental consulting services market size was valued between $51.8 billion and $60.01 billion in 2025. This massive market size suggests a significant portion of that spend is either handled internally or could be, if regulations allowed it.
Predictive modeling and remote sensing are supplementary, not full substitutes for empirical lab testing. While technology is advancing-and we see trends toward AI/ML and IoT advisory solutions in the broader consulting space-these tools generally support decision-making rather than replacing the final, legally defensible data point. You can't substitute a certified lab result with a drone image when facing an EPA consent order; the technology complements the empirical work.
Regulatory mandates for third-party verification limit substitution by non-accredited internal methods. This is where Montrose Environmental Group, Inc. (MEG) really locks in its value. For many critical services, especially those involving air emissions monitoring or complex site characterization, regulatory bodies like the U.S. EPA require data generated by accredited, independent laboratories or certified professionals. This effectively blocks the most direct substitution: a client simply signing off on their own internal results.
The complexity of emerging contaminants like PFAS makes substitution with generic services difficult. The market for PFAS testing alone is projected to grow from approximately $249.1 million in 2025 to $1,209.5 million by 2040, showing intense regulatory focus and technical difficulty. Quantification testing, which requires advanced methods like LC-MS/MS, captured about 40% of that market share in 2025. This specialized, high-stakes testing environment demands the specific expertise and accreditation that Montrose Environmental Group, Inc. (MEG) provides, making generic EHS teams or less sophisticated labs poor substitutes.
Here's a quick look at how the PFAS sub-market, where technical expertise is paramount, compares to the overall consulting spend and Montrose Environmental Group, Inc. (MEG)'s own revenue run-rate based on 2025 guidance.
| Metric | Value (2025) | Source/Context |
|---|---|---|
| Global Environmental Consulting Market Size | $51.8 Billion to $60.01 Billion | Overall market context |
| Montrose Environmental Group, Inc. (MEG) Revenue Guidance (FY 2025) | $810.0 Million to $830.0 Million | Full-year expectation |
| PFAS Testing Market Size | $249.1 Million to $610 Million | Range based on different market reports for 2025 |
| PFAS Testing Market CAGR (to 2034/2040) | 11.1% to 14.54% | Indicates high regulatory/technical demand |
The ability of Montrose Environmental Group, Inc. (MEG) to maintain high margins, with its Q3 2025 Adjusted Net Income margin hitting 15.0% of revenue, suggests clients are willing to pay a premium to avoid the risks associated with inadequate substitution. The company's focus on cross-selling and strong customer retention, which drove 8.3% organic revenue growth in 2024, further indicates that once a client is engaged, the perceived risk of switching to a substitute is too high.
The threat of substitution is therefore moderated by several factors:
- Internal EHS teams handle only routine, low-risk tasks.
- Regulatory requirements mandate third-party verification for critical data.
- Emerging contaminants like PFAS require specialized, accredited analytical methods.
- Remote sensing is currently an aid, not a replacement for empirical testing.
Finance: calculate the implied Q4 2025 revenue needed to hit the low end of the full-year guidance, using the Q3 revenue of $224.9 million.
Montrose Environmental Group, Inc. (MEG) - Porter's Five Forces: Threat of new entrants
The threat of new entrants for Montrose Environmental Group, Inc. (MEG) remains relatively low, primarily due to significant structural barriers that require substantial investment, time, and established trust to overcome in the environmental services sector.
- High capital requirement for specialized laboratory equipment and certifications acts as a barrier. Starting a dedicated environmental testing laboratory in 2025 commonly requires an initial investment ranging from $317,000 to over $1,260,000 depending on the niche and scale you target. You'll find that specialty or analytical equipment alone can easily cost $60,000 to $250,000+ per major unit. Plus, the facility setup, including benchtop installation, specialized plumbing, and safety cabinets, can add another $10,000 to $150,000 to those initial outlays. Honestly, this upfront cash requirement immediately screens out most small-scale competitors.
- Extensive government regulation and permitting requirements create high entry hurdles. Beyond the equipment cost, securing the necessary operational legitimacy is time-consuming and expensive. The certification process for an environmental testing facility often takes 6 to 12 months and can cost between $10,000 and $40,000 just for the scope and complexity of the initial services you plan to offer, not including ongoing compliance costs. New entrants must navigate unique federal, state, and local permitting requirements, which Montrose Environmental Group, Inc. has already mastered across its operations.
The sheer scale of Montrose Environmental Group, Inc. further complicates the entry landscape, especially for firms looking to compete across multiple service lines. Consider the established footprint:
| Metric | Montrose Environmental Group, Inc. (MEG) Data (Late 2025) | Implication for New Entrants |
| Trailing Twelve Month Revenue (TTM) | $826.32 million (as of Q3 2025) | Requires significant initial funding to match scale or niche focus. |
| Expected Full-Year 2025 Revenue Guidance | $810.0 million to $830.0 million | Demonstrates market share that new entrants must chip away at. |
| Total Employees | Approximately 3,410 to 3,500 | A large, specialized workforce is hard to staff quickly. |
| Geographic Footprint | 120 locations worldwide | New entrants face a long road to achieve similar geographic coverage. |
| Total Acquisitions Completed | 26 | Shows a history of consolidating market segments. |
- Montrose Environmental Group, Inc.'s continuous acquisition strategy consolidates the market, raising the bar for scale. By completing 26 acquisitions as of late 2025, including firms like Originslab in September 2024 and Spirit Environmental in July 2024, Montrose Environmental Group, Inc. systematically absorbs potential competitors or specialized capabilities. This strategy effectively reduces the available market space for a startup to gain initial traction and volume. The company's TTM revenue of $826.32 million as of September 30, 2025, shows the level of scale a new entrant would need to challenge.
- Established brand loyalty and deep regulatory relationships with clients are difficult to replicate quickly. Most of Montrose Environmental Group, Inc.'s clients are private sector companies operating under complex federal, state, and local regulations. Building the trust required to handle critical compliance, permitting, and response work takes years. For example, Montrose Environmental Group, Inc. representatives have served on technical panels supporting state environmental agencies, like the Colorado Department of Public Health & Environment, which signals deep, embedded regulatory credibility that a startup simply won't possess. You can't buy that kind of relationship overnight.
The barriers to entry are structural, capital-intensive, and relationship-dependent, which keeps the threat level low for the overall business.
- Capital needs for specialized analytical gear are high.
- Permitting and accreditation demand 6-12 months minimum.
- Scale is demonstrated by $826.32 million in TTM revenue.
- Regulatory relationships are built over time, not purchased.
Finance: calculate the average capital expenditure per acquisition over the last three years to benchmark future M&A activity by Friday.
Disclaimer
All information, articles, and product details provided on this website are for general informational and educational purposes only. We do not claim any ownership over, nor do we intend to infringe upon, any trademarks, copyrights, logos, brand names, or other intellectual property mentioned or depicted on this site. Such intellectual property remains the property of its respective owners, and any references here are made solely for identification or informational purposes, without implying any affiliation, endorsement, or partnership.
We make no representations or warranties, express or implied, regarding the accuracy, completeness, or suitability of any content or products presented. Nothing on this website should be construed as legal, tax, investment, financial, medical, or other professional advice. In addition, no part of this site—including articles or product references—constitutes a solicitation, recommendation, endorsement, advertisement, or offer to buy or sell any securities, franchises, or other financial instruments, particularly in jurisdictions where such activity would be unlawful.
All content is of a general nature and may not address the specific circumstances of any individual or entity. It is not a substitute for professional advice or services. Any actions you take based on the information provided here are strictly at your own risk. You accept full responsibility for any decisions or outcomes arising from your use of this website and agree to release us from any liability in connection with your use of, or reliance upon, the content or products found herein.