
|
Manulife Financial Corporation (MFC): Marketing Mix Analysis [Apr-2026 Updated] |
Fully Editable: Tailor To Your Needs In Excel Or Sheets
Professional Design: Trusted, Industry-Standard Templates
Investor-Approved Valuation Models
MAC/PC Compatible, Fully Unlocked
No Expertise Is Needed; Easy To Follow
Manulife Financial Corporation (MFC) Bundle
You're trying to get a clear picture of how a major insurer like Manulife Financial Corporation is actually positioned as we close out 2025, and honestly, the numbers coming out of Q3 tell a compelling story of focused growth. After years of watching these firms, I see a strategy that's translating directly to the bottom line: core earnings hit a record $2.0 billion, and their core Return on Equity (ROE) is a solid 18.1%. This performance isn't accidental; it's the result of pushing new private credit capabilities, expanding aggressively in Asia with a new India Joint Venture, and backing their global 'Where will better take you' brand with serious AI maturity. So, if you want to know exactly how their Product mix, Place strategy, Promotion spend, and Pricing power are driving these results, stick with me; we're about to unpack the four P's for Manulife Financial Corporation.
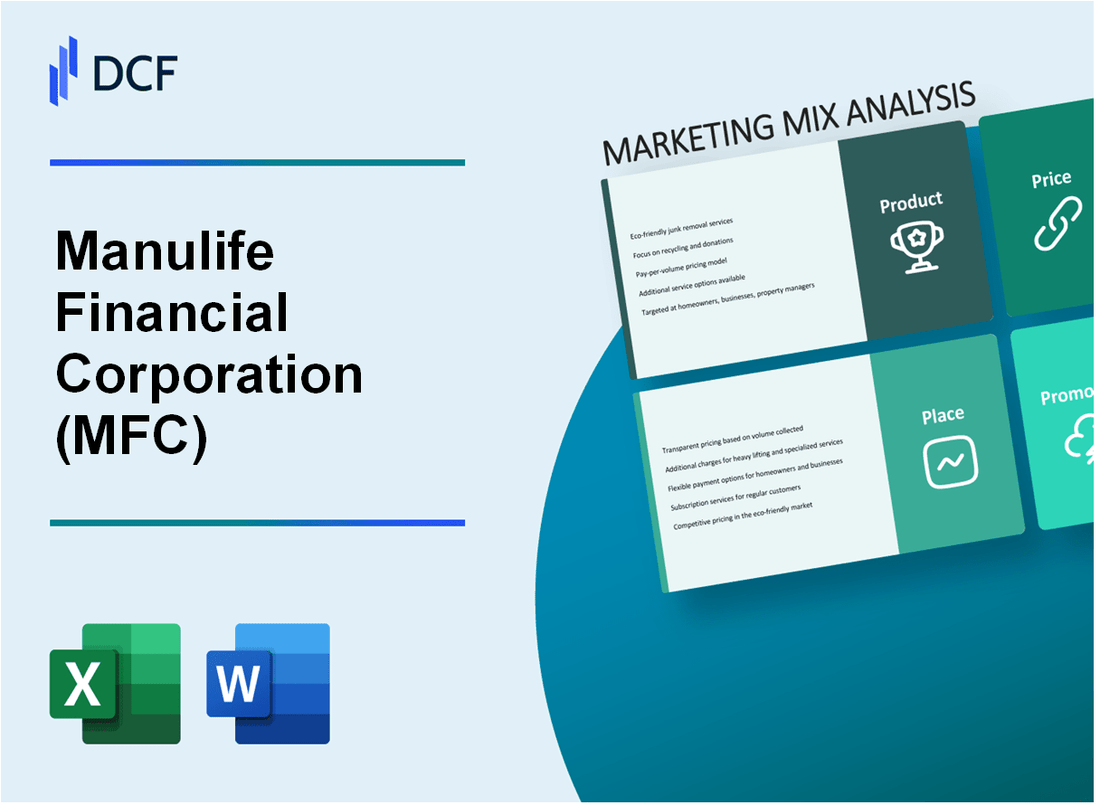
Manulife Financial Corporation (MFC) - Marketing Mix: Product
You're looking at the core offerings from Manulife Financial Corporation as of late 2025. The product element is about what Manulife Financial Corporation actually sells, which spans protection, savings, and investment solutions across its global client base of more than 36 million customers. This product suite is segmented across its major operating areas: Asia, Canada, and the U.S.
Life, health, and income insurance form the bedrock of Manulife Financial Corporation's financial security offerings. These include a variety of individual life insurance, individual and group long-term care insurance, and guaranteed and partially guaranteed annuity products distributed across the U.S., Canada, and Asia. The momentum in the insurance segment is clear from the new business figures; for instance, Q3 2025 saw a 32% increase in New Business Value (NBV) compared with 2023. In the first quarter of 2025, new business value growth was double-digit across all insurance segments, with Asia leading the charge with a 43% year-over-year increase in new business value. The company also recently increased its quarterly dividend to $0.44, which annualizes to $1.76 per share.
Global Wealth and Asset Management (WAM) serves as a key growth pillar, balancing the risk inherent in the insurance business with fee-based revenue. Manulife Investment Management offers a diverse set of investment vehicles, including mutual funds, Separately Managed Accounts (SMAs), 529 plans, Registered Education Savings Plans (RESPs), Exchange-Traded Funds (ETFs), Collective Investment Trusts (CITs), model portfolios, and group retirement, savings, and rollover plans. The scale of this operation is significant, though recent flows have shown some variability. As of September 30, 2025, Manulife Global Wealth and Asset Management reported total Assets Under Management and Administration (AUMA) of $475.1 billion CAD.
| WAM Metric (as of September 30, 2025) | Amount (CAD) |
| Total AUMA | $475.1 billion |
| Assets Under Management (AUM) | $233.7 billion |
| Assets Under Administration (AUA) | $241.4 billion |
For the second quarter of 2025, Global WAM delivered net inflows of $0.9 billion, although the third quarter of 2025 saw a negative net flow of $6.2 billion in asset management inflows. The company is working toward a 2027 target Core Return on Equity (ROE) of 18%, up from the 15.0% reported for Q2 2025.
The John Hancock Vitality program is central to Manulife Financial Corporation's product differentiation, driving behavioral insurance and wellness-linked products by rewarding healthier choices. This program has generated substantial, measurable health improvements among its members:
- Members walk twice as many steps daily as the average American.
- 52% of members with high blood pressure reported bringing readings into a healthy range.
- 63% reported improving their cholesterol levels.
- Nearly 45% reported reducing their Body Mass Index (BMI).
- Users logged over 5 million minutes on the Headspace meditation app in 2024.
- Most engaged members interact with the program 20-30x per month.
- For the Galleri cancer test, 100% of the cost is subsidized for eligible policies with Face Amounts of $500,000 or greater.
Manulife Financial Corporation's strategic focus is clearly on empowering customer health, wealth, and longevity. This is evidenced by the goal to generate 50% of its core earnings from high-growth Asia markets by 2025. The company is also actively building out its private markets capabilities to serve these longevity and wealth objectives.
A major product enhancement in late 2025 is the addition of new private credit capabilities via the acquisition of a 75% stake in Comvest Credit Partners. Manulife Financial Corporation agreed to an upfront consideration of $937.5 million for this stake, which is expected to close in the fourth quarter of 2025. This transaction aligns Manulife's existing $3.7 billion Senior Credit team with Comvest, immediately creating a leading private credit asset management platform with $18.4 billion in assets under management. Comvest brought $14.7 billion onto the platform at the time of the agreement, and Manulife Financial Corporation may pay an additional consideration of up to $337.5 million based on performance targets.
Manulife Financial Corporation (MFC) - Marketing Mix: Place
Place, or distribution, is about getting Manulife Financial Corporation's products to the customer, which involves a complex, global network of direct and intermediary channels.
Global Footprint and Operational Reach
Manulife Financial Corporation's distribution strategy is inherently global, reflecting its diverse operational structure. You see the company operating as Manulife across Canada, Asia, and Europe, while the United States business is primarily conducted under the John Hancock division. Specifically within Asia, Manulife Financial Corporation maintains insurance operations across 12 markets. This geographic diversification is a core component of its distribution resilience.
The scale of its physical and partner distribution network is substantial. As of the end of 2024, Manulife Financial Corporation supported its distribution with over 109,000 agents and thousands of other distribution partners, serving over 36 million customers globally. This mix of direct and intermediary access is critical for market penetration.
To give you a quick view of the scale of the distribution force:
| Distribution Component | Metric/Count (As of End of 2024) | Geographic Context |
| Agents | Over 109,000 | Global |
| Distribution Partners | Thousands | Global |
| Customers Served | Over 36 million | Global |
Strategic Channel Expansion and Deepening Presence
Manulife Financial Corporation is actively making strategic moves to capture growth in key areas. A significant recent action is the new strategic entry into the fast-growing India insurance market via a 50-50 life insurance Joint Venture with Mahindra & Mahindra Ltd., announced in November 2025. This move is a long game, with each shareholder committing up to US$400 million in total capital, including an expected initial investment of US$140 million each over the first five years. This is aimed at tapping into a market where the life insurance sector has grown at a 12% CAGR over the past five years, surpassing US$20 billion in new business premiums.
Bancassurance partnerships remain a crucial channel, especially for accelerating growth in Asian markets. These partnerships allow Manulife Financial Corporation to access established bank customer bases. For example, in the first quarter of 2025, Manulife extended its exclusive bancassurance partnership in the Philippines with China Banking Corporation for another 15 years. The strength of these channels is evident in the Asia segment's performance; in Q1 2025, Annualised Premium Equivalent (APE) sales for Asia rose to US$1.41 billion, marking a 50% increase year-over-year.
The distribution channels include:
- Direct agency force, which is being augmented by technology.
- Bancassurance relationships, key in markets like the Philippines and Vietnam (with VietinBank).
- Manulife Investment Management distribution across 19 geographies.
Distribution Optimization via Technology
You're looking at a massive investment in technology to make this distribution machine run smoother. Manulife Financial Corporation has made a multi-billion-dollar investment in its digital transformation, including cloud-based data and AI platforms, specifically to optimize the complex customer journey. The company expects its digital capabilities, including AI enhancements, to generate a threefold return on investment over five years through 2027, targeting over $600 million of benefits. The adoption rate is high; 100% of the company's workforce has access to AI tools, with 75% of them using these tools regularly. Furthermore, Manulife Financial Corporation deployed 35 GenAI use cases across Canada, the US, and Asia to date, with 70 more prioritized to be deployed by the end of 2025. In North America, GenAI-powered solutions are already handling over 110 million customer calls annually, showing direct application in customer interaction points.
Manulife Financial Corporation (MFC) - Marketing Mix: Promotion
You're looking at the promotional activities Manulife Financial Corporation is using to connect its global brand with customers as of late 2025. The focus is clearly on unifying the message while executing locally where it counts, heavily leaning on digital proof points and major thought leadership investments.
Global Brand Unification and Tagline
- Global brand strategy uses the unifying 'Where will better take you' tagline.
- This tagline was launched in June 2024, designed to connect the company's services to the customer's personal future and potential.
- The core mission reinforced by this promotion is 'Decisions made easier. Lives made better.'
Thought Leadership and Purpose-Driven Promotion
Manulife Financial Corporation is using significant financial commitments to anchor its promotional narrative around longevity and healthspan, which is a key differentiator in the insurance space. This is a clear move to own a future-focused conversation.
- Commitment of $350 million through 2030 for the Longevity Institute research platform.
- The Institute, known as the John Hancock Longevity Institute in the United States, is a global platform for research, thought leadership, advocacy, and community investment.
- This initiative aims to close the gap between lifespan and healthspan, noting that many people spend up to 20% of their lives in poor health and nearly 40% face financial insecurity as they age.
Digital Maturity as a Promotional Asset
The company is actively promoting its technological leadership, using third-party validation to build trust. Being recognized as a leader in AI maturity directly supports the personalization aspect of their marketing efforts.
- Recognized as the #1 life insurer for AI maturity by the Evident AI Index for Insurance in June 2025.
- Manulife expects its digital investments, including AI-enabled enhancements, to generate a threefold return on investment over five years through 2027.
- Over $600 million of benefits were realized in 2024 from global digital customer leadership initiatives.
The strength of their digital foundation is a quantifiable metric they use to signal competence. Here's the quick math on their SEO standing:
| Digital Metric | Value | Context |
|---|---|---|
| Organic Keywords (manulife.com) | 18,780 | Indicates solid SEO tactics for organic search visibility. |
| Typical Monthly Traffic (manulife.com) | 90K+ | Reflects consistent brand search volume. |
| Digital Investments ROI Target | Threefold | Expected return by 2027 from AI/digital capabilities. |
Localized Execution and Regional Wins
The global message is tailored for local resonance, especially in high-growth regions like Asia, where specific campaigns are winning awards. This shows a commitment to local relevance, which is defintely smart.
- Localized campaigns in Canada and Asia complement the global brand message.
- In Asia, Manulife Philippines won Marketing Initiative of the Year for the 'Manulife Stories' brand campaign at the Insurance Asia Awards 2025.
- The 'Manulife Stories' campaign achieved over 100 million impressions and a 20-point ad recall lift, breaking regional benchmarks.
- Specific regional performance highlights include Asia Annual Premium Equivalent (APE) sales increasing 50% in Q1 2025.
- In Canada, APE sales increased 9% from the prior year in Q1 2025, supporting the aspiration to be the undisputed insurance leader in the home market.
Manulife Financial Corporation (MFC) - Marketing Mix: Price
Price, in the context of Manulife Financial Corporation, is reflected not only in the premiums and fees charged for insurance and wealth management products but also in the cost of capital and financing options available to support its business growth and competitive positioning. The company's ability to command a price that reflects its perceived value is evident in its recent financial performance.
The company's strong profitability metrics suggest effective pricing power across its segments:
- Q3 2025 core earnings hit a record $2.0 billion, up 10% year-over-year on a constant exchange rate basis.
- Core Return on Equity (ROE) reached 18.1% in Q3 2025, showing strong profitability.
- Pricing power is evident with Annualized Premium Equivalent (APE) sales up 19% for the first nine months of 2025.
- Value-based pricing is supported by a New Business Value (NBV) increase of 11% in Q3 2025.
- Risk mitigation, like the U.S. long-term care reinsurance, stabilizes the overall pricing model.
You can see how these performance indicators translate into tangible results that underpin the pricing strategy:
| Metric | Q3 2025 Value | Year-over-Year Change |
| Core Earnings | $2.0 billion | 10% (CER basis) |
| Core Return on Equity (ROE) | 18.1% | Up 1.5 percentage points |
| APE Sales (Q3 2025) | C$2.6 billion | Up 8% |
| New Business Value (NBV) (Q3 2025) | C$906 million | Up 11% |
| Quarterly Dividend | 44.0 cents per share | Up 10% year-over-year |
Furthermore, Manulife Financial Corporation actively manages its cost of capital, which is a key component of its overall pricing structure for long-term liabilities and investments. This involves strategic debt management to secure favorable financing terms. For instance, in early December 2025, the company priced a significant debt offering:
- Public offering of senior notes in the United States totaling U.S.$1.00 billion aggregate principal amount.
- The notes carry a coupon rate of 4.986% and are due in 2035.
- The offering price was set at 100% of the principal amount.
- Proceeds are earmarked for general corporate purposes, potentially including future refinancing requirements.
The company's valuation metrics also reflect market perception of its pricing and future earnings potential. As of late 2025, the trailing Price-to-Earnings (P/E) ratio stood at 14.1x, which was noted as being just below the peer average of 14.9x. This suggests that while the market recognizes the value derived from its pricing power, there might still be room for multiple expansion if growth momentum is sustained. The dividend policy, with the quarterly dividend recently raised to 44.0 cents per share, implies a yield around 5.0% based on recent share prices, offering a tangible return component to the overall customer value proposition.
Disclaimer
All information, articles, and product details provided on this website are for general informational and educational purposes only. We do not claim any ownership over, nor do we intend to infringe upon, any trademarks, copyrights, logos, brand names, or other intellectual property mentioned or depicted on this site. Such intellectual property remains the property of its respective owners, and any references here are made solely for identification or informational purposes, without implying any affiliation, endorsement, or partnership.
We make no representations or warranties, express or implied, regarding the accuracy, completeness, or suitability of any content or products presented. Nothing on this website should be construed as legal, tax, investment, financial, medical, or other professional advice. In addition, no part of this site—including articles or product references—constitutes a solicitation, recommendation, endorsement, advertisement, or offer to buy or sell any securities, franchises, or other financial instruments, particularly in jurisdictions where such activity would be unlawful.
All content is of a general nature and may not address the specific circumstances of any individual or entity. It is not a substitute for professional advice or services. Any actions you take based on the information provided here are strictly at your own risk. You accept full responsibility for any decisions or outcomes arising from your use of this website and agree to release us from any liability in connection with your use of, or reliance upon, the content or products found herein.