
|
Manulife Financial Corporation (MFC): PESTLE Analysis [Apr-2026 Updated] |
Fully Editable: Tailor To Your Needs In Excel Or Sheets
Professional Design: Trusted, Industry-Standard Templates
Investor-Approved Valuation Models
MAC/PC Compatible, Fully Unlocked
No Expertise Is Needed; Easy To Follow
Manulife Financial Corporation (MFC) Bundle
If you're tracking Manulife Financial Corporation (MFC), the 2025 landscape is defined by a high-stakes balance: the tailwind of high global interest rates boosting net investment income versus the headwind of geopolitical instability in Asia. While the aging populations in North America and the growing middle class in markets like Vietnam are driving demand, the company is betting big on technology-specifically, AI is projected to cut operational expenses by an estimated 15% in some segments. Still, that efficiency gain is directly offset by the massive compliance costs from IFRS 17 implementation and the constant need to defend over $1.4 trillion in assets under management from escalating cyber threats. Let's drill down into the six macro-forces that will defintely dictate Manulife's strategic moves this year.
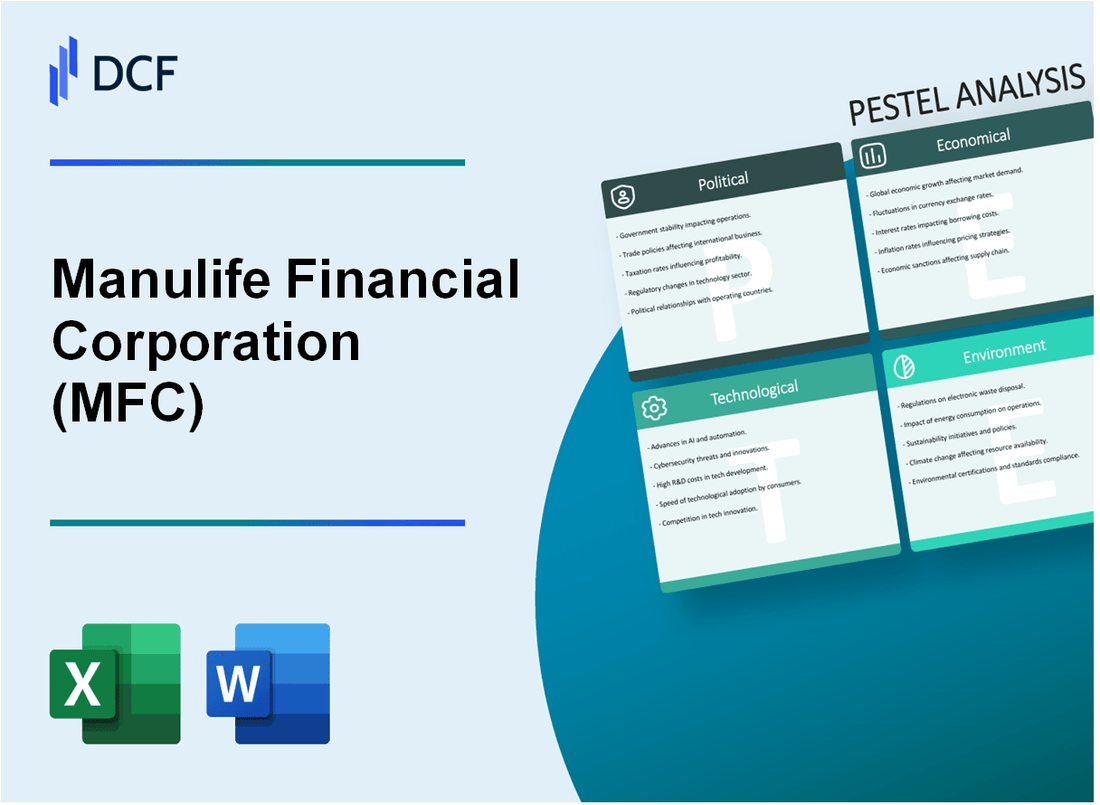
Manulife Financial Corporation (MFC) - PESTLE Analysis: Political factors
You need a clear view on how global politics are actually hitting Manulife Financial Corporation's (MFC) bottom line right now, not just theoretical risks. The headline is this: Asia's political volatility is a constant headwind, but the region's massive growth still makes it the primary earnings engine, while Canadian tax changes have created a defintely favorable domestic opportunity.
Geopolitical tensions in Asia, especially China/Hong Kong, directly affect premium growth and asset stability.
Asia is Manulife's biggest growth driver, so political friction in the region is a direct threat to its core earnings. In the third quarter of 2025 (3Q25), the Asia segment delivered record-high core earnings of $550 million (C$ equivalent), a 29% year-over-year (YoY) increase, which is a huge number. But you need to watch where that growth is coming from.
While overall Asia Annualized Premium Equivalent (APE) sales were up 5% to $1.45 billion (US$ equivalent) in 3Q25, the growth was mainly driven by markets outside of Hong Kong and Japan. Hong Kong sales, which are highly sensitive to mainland China's economic and political sentiment, remain a key area of volatility. Any sudden regulatory shift from Beijing or escalation of political unrest in Hong Kong could immediately impact the flow of mainland Chinese visitors purchasing insurance policies, which is a crucial sales channel.
Here's the quick math on Asia's importance:
- Asia 3Q25 Core Earnings: $550 million (C$ equivalent)
- Asia New Business Value (NBV) 3Q25: $490 million (US$ equivalent), up 7% YoY
- This segment is the clear leader in new business value creation.
Canadian federal tax policy changes could impact domestic life insurance product competitiveness.
The Canadian government's tax changes in 2025 have unexpectedly created a tailwind for domestic life insurance products, which is great for Manulife's Canada segment. The change is all about capital gains. For individuals with annual capital gains over $250,000, and for all corporations and trusts, the capital gains inclusion rate jumped from 50% to 66.67% (two-thirds).
This policy change makes permanent life insurance products, like Participating Whole Life and Universal Life, much more attractive as wealth transfer tools. Why? Because the death benefit from these policies remains tax-free, offering a sheltered way to pass on wealth and cover the now-higher capital gains tax liability on other assets like real estate or business sales. This is a clear opportunity for Manulife to drive higher-margin sales in its home market, where 3Q25 core earnings were up 4% YoY.
US-China trade relations instability creates volatility for Manulife's significant asset management arm, John Hancock.
The political relationship between the US and China directly affects global market stability, which in turn impacts the performance of Manulife's Global Wealth and Asset Management (Global WAM) division, branded as John Hancock in the US. This division's core earnings were $525 million (C$ equivalent) in 3Q25, up 9% YoY. The volatility impacts their fee income and net flows.
The good news is that the near-term political risk has stabilized somewhat. A landmark US-China trade deal was reached in late 2025, which included a reduction in US import duties on Chinese goods from 57% to 47%, with an implementation timeline starting November 10, 2025. This kind of de-escalation stabilizes global supply chains and capital markets, reducing the risk of sudden, trade-related shocks that could hurt John Hancock's investment performance and lead to client redemptions.
Regulatory stability in key markets (Canada, US, Vietnam, Indonesia) is defintely a crucial factor for capital planning.
For a global insurer, regulatory stability is the foundation of capital planning and risk management. Manulife operates under a complex web of rules, but its capital position remains robust, which is a key political/regulatory metric.
The company's Life Insurance Capital Adequacy Test (LICAT) ratio, a crucial measure of its financial strength mandated by Canadian regulators, stood at a strong 138% in 3Q25. This is well above the minimum regulatory requirements and provides a substantial buffer against unexpected political or economic shocks in markets like Vietnam and Indonesia, where Manulife is expanding. A high LICAT ratio signals that Manulife has the capacity to withstand regulatory changes or unexpected claims without needing a capital injection.
| Segment | 3Q25 Core Earnings (C$ Millions) | YoY Core Earnings Change | Key Political/Regulatory Factor |
|---|---|---|---|
| Asia | $759 | +29% | Geopolitical stability in Hong Kong/China for sales access. |
| Canada | $449 | +4% | Favorable impact of the 2025 Canadian capital gains tax hike. |
| U.S. | $241 | -33% | US regulatory environment (e.g., life insurance claims experience, credit provisions). |
| Global WAM (John Hancock) | $525 | +9% | US-China trade deal stability affecting global asset valuations. |
Next step: Operations team needs to model the revenue uplift from the Canadian capital gains tax change on the Individual Insurance product line by the end of the quarter.
Manulife Financial Corporation (MFC) - PESTLE Analysis: Economic factors
Global interest rate trajectory: A prolonged high-rate environment boosts net investment income, improving 2025 core earnings outlook.
You know that for a life insurer with long-duration liabilities, a higher-for-longer interest rate environment is generally a tailwind. This is definitely playing out for Manulife Financial Corporation in 2025. The core earnings growth is strong, partly driven by improved investment spreads (the difference between what the company earns on its assets and what it pays on its liabilities).
The company's underlying business performance, boosted by these spreads, helped deliver Q3 2025 core earnings of $2.0 billion, marking a 10% increase on a constant exchange rate (CER) basis over Q3 2024. Year-to-date core earnings through September 30, 2025, reached $5.528 billion. This is a clear benefit of the current rate environment, especially visible in the Canada segment, which reported a 4% core earnings increase, largely due to those higher investment spreads.
Still, you have to watch the immediate market sensitivity. As of September 30, 2025, Manulife estimated that a 50 basis point (0.50%) parallel increase in interest rates would result in a $100 million charge to net income, largely related to the complex accounting for variable annuity contracts. That's a quick reminder that the benefit isn't a straight line.
Inflationary pressures increase operating costs, but higher rates offset this for long-duration liabilities.
Inflation is a real cost-of-doing-business problem, but Manulife has been effective at managing it. While the general cost of labor and services is up across North America and Asia, the company has maintained tight expense discipline. For example, the Global Wealth and Asset Management (Global WAM) segment successfully expanded its core EBITDA (Earnings Before Interest, Taxes, Depreciation, and Amortization) margin by a significant 310 basis points in Q3 2025, driven by this disciplined approach.
The bigger picture is that the positive impact of higher rates on the investment side-specifically for long-duration liabilities like those in life insurance-outweighs the operational cost inflation. The higher discount rates used to value these future liabilities reduce their present value, which is a key non-cash benefit. The company's overall core expenses saw a 3% reduction in Q2 2025 compared to Q2 2024, showing they are defintely winning the cost-control battle right now.
Currency fluctuation risk, particularly the Canadian dollar versus the US dollar and Asian currencies, affects repatriated earnings.
Manulife is a global giant headquartered in Canada, so currency risk is a permanent fixture in the P&L (Profit and Loss statement). The Canadian dollar (CAD) is the reporting currency, but a massive portion of core earnings-specifically 76% year-to-date 2025-comes from the high-potential Asia and Global WAM segments, which are primarily denominated in USD and various Asian currencies.
When the CAD weakens, those foreign earnings translate into more Canadian dollars, which is a favorable boost. When the CAD strengthens, it's a headwind. You can see the volatility in 2025: the CAD/USD rate was trading around 1.4112 (USD per CAD) in November 2025, and the CAD/HKD rate swung from a high of 5.7835 HKD in June 2025 to a low of 5.5097 HKD in November 2025. That 4.9% swing in the Hong Kong dollar alone can materially impact the reported $550 million in Q3 2025 core earnings from the Asia segment.
Here's the quick math on the geographic distribution of their core earnings:
| Segment | Q3 2025 Core Earnings (C$ millions) | YTD 2025 Core Earnings (C$ millions) | YTD 2025 Contribution to Total Core Earnings |
|---|---|---|---|
| Asia | $550 | $2,184 | ~39.5% |
| Global WAM | $463 | $1,337 | ~24.2% |
| Canada | $419 | $1,268 | ~22.9% |
| U.S. | $251 | $565 | ~10.2% |
| Corporate & Other | $352 | $174 | ~3.2% |
| Total | $2,035 | $5,528 | 100% |
Slowing economic growth in North America could dampen demand for discretionary wealth management products.
A slowing economy in North America is the primary risk to the Global WAM business, which provides investment and retirement solutions. When consumers and institutions feel uncertain about the economy, they pull back on discretionary investments and shift assets to lower-fee, less profitable products, or simply redeem them.
This is exactly what happened in Q3 2025, where the Global WAM segment reported significant net outflows of $6.2 billion. To be fair, this compares to a net inflow of $5.2 billion in Q3 2024, so the swing is dramatic. The outflows were concentrated in the most economically sensitive areas:
- Retail channels via North American intermediaries.
- The Canada wealth platform.
- U.S. Retirement products.
This $6.2 billion outflow demonstrates that North American clients are already showing caution, a direct consequence of the economic slowdown that Manulife Investment Management itself forecasts for the second half of 2025.
Manulife Financial Corporation (MFC) - PESTLE Analysis: Social factors
Aging populations in North America and Japan drive demand for retirement and long-term care solutions.
The demographic shift toward an older population in Manulife Financial Corporation's (MFC) mature markets is the single most important social tailwind for its wealth and retirement business. In Japan, the share of the population aged 65 or older reached a record 29.4% as of September 2025, with the UN projecting this share to be 30.0% for the full year. This creates a massive, sustained demand for products that generate retirement income and cover long-term care expenses.
In response, MFC is doubling down on its longevity strategy. They launched the Longevity Institute in November 2025, backed by a $350 million commitment through 2030, to drive innovation in health and financial resilience. This isn't just about selling policies; it's about addressing the widening gap between lifespan and healthspan-the number of years people live in good health. This focus defintely positions MFC as a partner, not just a provider, for an aging customer base.
Growing middle class in emerging Asian markets (e.g., Vietnam, Philippines) fuels strong demand for life and health insurance.
The rapidly expanding middle class across Asia is the primary engine for MFC's top-line growth. This demographic segment is moving from basic savings to needing complex protection and wealth accumulation products. The results from the first half of 2025 underscore this trend: the Asia segment delivered exceptional performance, with Annualised Premium Equivalent (APE) sales jumping 50% year-over-year in Q1 2025 to US$1.41 billion. New Business Value (NBV) also soared by 43% in the same quarter.
Here's the quick math on Vietnam's market opportunity: Manulife Vietnam's total assets grew 6% year-on-year to nearly VNĐ145 trillion (approximately US$5.8 billion) in the first half of 2025, demonstrating strong local market penetration. In the Philippines, MFC solidified its distribution by extending its exclusive bancassurance (selling insurance through a bank) partnership with China Banking Corporation for another 15 years in Q1 2025. You can see the opportunity is enormous, and MFC is locking in distribution.
| Asia Segment Growth Metric (Q1 2025) | Value / Amount | YoY Growth |
|---|---|---|
| Annualised Premium Equivalent (APE) Sales | US$1.41 billion | 50% |
| New Business Value (NBV) | US$457 million | 43% |
| New Business Contractual Service Margin (CSM) | US$498 million | 38% |
Increased public awareness of mental health and wellness necessitates new, integrated health insurance offerings.
Customers now view health holistically, including mental health, and expect insurance products to reflect this. MFC is moving beyond simple illness coverage to integrated wellness programs. In Q1 2025, the company launched a new International High Net Worth proposition in Asia that combines life insurance with comprehensive health benefits, including access to medical second opinion concierge services.
The Manulife Vitality program in Canada, which rewards healthy choices, was expanded in November 2025 to include new partners and services that directly address mental and physical well-being. This is a necessary evolution to meet consumer demand for preventative care, not just claims processing. It's a shift to behavioral insurance.
- Integrate virtual care: Added KixCare for 24/7 virtual care, supporting physical and mental health for children and teens.
- Prioritize early detection: Offers access to advanced biomarker testing (NiaHealth) and the Galleri® multi-cancer early detection test for eligible members.
- Focus on longevity: The $350 million Longevity Institute commitment includes specific support for physical, mental, and emotional well-being.
Shift to digital-first customer interaction requires streamlined, user-friendly service platforms.
The social expectation for instant, seamless digital service, driven by e-commerce and fintech, is now standard in financial services. MFC has responded with significant capital deployment, committing another C$1 billion to digital customer initiatives from 2023 through 2025. This investment focuses on making the customer experience frictionless.
The company is rapidly scaling its use of Artificial Intelligence (AI) to enhance service efficiency. In Q1 2025, MFC deployed generative AI-based assistants in key Asian markets like Singapore and Japan to streamline agent and broker support, which cuts down on wait times and improves the quality of service for the end customer. In the U.S. market, they launched FutureStep$^{\text{TM}}$ in Q1 2025, a fully digital retirement plan offering for small businesses, showing a clear move to digital-only product delivery. Digital is no longer an option; it's the core delivery mechanism.
Next Step: Global Wealth & Asset Management (WAM) Team: Assess the Q1 2025 NBV growth in Asia against the C$1 billion digital investment to calculate a preliminary digital ROI by end of Q4 2025.
Manulife Financial Corporation (MFC) - PESTLE Analysis: Technological factors
Rapid adoption of Artificial Intelligence (AI) for underwriting and claims processing reduces operational expenses by an estimated 15% in some segments.
You are seeing a major shift in how core insurance work gets done, and Manulife Financial Corporation is defintely leading the charge. The company is not just dabbling in Artificial Intelligence (AI); it's building an AI-powered organization from the ground up. This isn't about small tweaks, but a structural push for efficiency.
The core goal is simple: automate the high-volume, repetitive tasks that drive up costs. The company is deploying its proprietary Agentic AI Platform, a secure, integrated foundation designed to accelerate the rollout of AI agents across the business. This is why Manulife expects AI to generate $1 billion of value by 2027, with roughly 20% of that value coming directly from improved operational efficiency.
In the near term, we can already see the scale of this investment. By the end of 2025, Manulife will have deployed over 105 generative AI (GenAI) use cases across Canada, the U.S., and Asia, building on the 35+ use cases already in production as of mid-2025. This rapid adoption is designed to achieve the kind of productivity gains that translate to a projected 15% reduction in operational expenses within specific, high-touch segments like claims and underwriting.
| AI/Digitalization Metric | 2025 Fiscal Year Data Point | Strategic Impact |
|---|---|---|
| Expected Value from AI (by 2027) | $1 billion | Sets the long-term financial target for the AI strategy. |
| Efficiency Contribution to AI Value | Approximately 20% of $1 billion | Quantifies the expected cost-saving lever. |
| GenAI Use Cases (Target by EOY 2025) | Over 105 (35+ deployed, 70+ prioritized) | Shows the aggressive pace of technology deployment. |
| Workforce Engagement with GenAI | Over 75% of the global workforce | Indicates successful internal adoption and cultural shift. |
Cybersecurity risks are escalating, requiring substantial annual investment in defense to protect over $1.4 trillion in assets under management.
The flip side of digital transformation is the massive, ever-present risk of a cyber breach. When you manage a portfolio of the size Manulife does-with Assets Under Management and Administration (AUMA) totaling $1.6 trillion at the end of 2024-the stakes are enormous. A single, successful attack could trigger catastrophic financial and reputational damage.
This is why cybersecurity is no longer just an IT cost; it's a core business defense strategy. The company's digital transformation includes a multi-billion-dollar investment in a cloud-based data and AI platform, which embeds automated assurance and security controls from the ground up. Honestly, this is the only way to protect customer data and the balance sheet at this scale.
While a precise 2025 cybersecurity budget is not publicly itemized, we know the company's overall annual Information and Communications Technology (ICT) spending was in the range of $535.1 million in 2023, and a substantial, increasing portion of this budget is now dedicated to defense, real-time threat monitoring, and compliance with evolving global regulations. This spending is non-negotiable.
Telematics and wearable tech integration allows for personalized, risk-based pricing in health and life insurance products.
This is where Manulife is fundamentally changing the value proposition of life insurance. They pioneered the Manulife Vitality program, which is the only one of its kind in Canada, to move from a purely transactional model to a preventative one. It's smart life insurance.
The program integrates data from telematics (like fitness apps) and wearable technology (like Apple Watch or Garmin) to reward policyholders for healthy behavior. This creates a shared value model: healthier customers mean lower claims for the insurer, and customers get financial incentives.
The benefits are concrete: policyholders can earn savings of up to 15% off their annual premium on eligible life insurance products, and the program has expanded in 2025 to include new partners for holistic health, such as Cronometer for nutrition tracking and KixCare for virtual pediatric care. This integration allows for truly personalized, risk-based pricing that traditional carriers simply can't match.
Legacy system modernization is a continuous, high-cost project that slows the pace of new product rollout.
Despite the massive strides in AI and cloud infrastructure-with approximately 80% of Manulife's applications already in the cloud-the job of modernization is never truly finished. The company's multi-billion-dollar digital investment is largely focused on migrating away from decades-old legacy systems (mainframes, outdated databases) that are expensive to maintain and lack the agility for modern product development.
The good news is that the move to a single-cloud platform, like Microsoft Azure, has already demonstrated success, helping to reduce development costs by 50 percent in some areas. But still, the industry average is that 70% of IT budgets go toward simply maintaining these older systems, which is a massive drag on innovation velocity.
The challenge is that every new product, every new regulatory requirement, and every new AI agent needs to integrate with these older, inflexible platforms. This constant integration work is what slows down the time-to-market for new offerings, forcing Manulife to maintain a constant, multi-year 'Targeted Estate Modernization' program to keep up with customer expectations.
Next Step: Finance needs to model the net present value of the $1 billion AI value target against the remaining legacy system migration cost by the end of the quarter.
Manulife Financial Corporation (MFC) - PESTLE Analysis: Legal factors
Implementation of IFRS 17 (International Financial Reporting Standard 17) changed how Manulife reports insurance contract liabilities, affecting 2025 reported net income.
The shift to International Financial Reporting Standard 17 (IFRS 17), effective for Manulife Financial Corporation, fundamentally changes how the company measures and reports its insurance contract liabilities. This isn't just an accounting tweak; it alters the timing of profit recognition, which directly impacts your reported net income. The new standard capitalizes expected future profits into a Contractual Service Margin (CSM), which is then amortized into earnings over the life of the policy, aiming for a smoother earnings profile.
In the third quarter of 2025, the annual review of actuarial methods and assumptions under IFRS 17 resulted in a net favorable impact of a $605 million decrease in pre-tax fulfillment cash flows. This is a big number. Specifically, this contributed to a decrease in pre-tax net income attributed to shareholders of $244 million, or $216 million post-tax. The Contractual Service Margin (CSM), which represents the unearned profit liability, increased by $1,080 million from this review. As of September 30, 2025, the post-tax CSM net of Non-Controlling Interests (NCI) stood at $20,537 million. This new reporting structure requires investors to focus heavily on the CSM movement to gauge new business profitability, not just the reported net income. It just makes the profit picture clearer, but more complex to model.
| IFRS 17 Impact on Q3 2025 Actuarial Review | Amount (in Millions) |
|---|---|
| Net Favorable Impact on Pre-Tax Fulfillment Cash Flows | $605 |
| Decrease in Pre-Tax Net Income Attributed to Shareholders | $244 |
| Decrease in Post-Tax Net Income Attributed to Shareholders | $216 |
| Increase in Contractual Service Margin (CSM) | $1,080 |
| Post-Tax CSM Net of NCI (as of Sept 30, 2025) | $20,537 |
Evolving data privacy laws (e.g., GDPR, CCPA) increase compliance costs and restrict data use for marketing and underwriting.
The global patchwork of evolving data privacy laws, like the European Union's General Data Protection Regulation (GDPR) and the California Consumer Privacy Act (CCPA) with its amendments (CPRA), creates a significant compliance burden and cost for a multinational insurer like Manulife. The company has to continually update its policies, including a July 2025 revision to its global privacy policy, to meet these disparate requirements. This is a constant drain on IT and legal budgets.
The key challenge is the restriction on using customer data for core insurance functions. These laws impose strict rules on data collection, requiring explicit consent for marketing and limiting the use of personal information, including health data, for underwriting and risk modeling. For instance, compliance with the CCPA/CPRA is mandatory for businesses with annual gross revenues exceeding $26.6 million in 2025, a threshold Manulife easily surpasses. Plus, new state laws like the Minnesota Consumer Data Privacy Act (MCDPA), effective July 31, 2025, add another layer of complexity. The cost of training alone for a global workforce of over 40,000 employees can range from $50 to $1,000 per employee annually, a substantial, recurring operational expense to avoid fines that can reach up to 4% of global annual revenue under GDPR.
Anti-money laundering (AML) and Know Your Customer (KYC) regulations are becoming stricter, especially in high-growth Asian markets.
Manulife's extensive operations in high-growth Asian markets-which are a core part of its strategy-expose it to increasingly stringent Anti-Money Laundering (AML) and Know Your Customer (KYC) regulations. Regulators in jurisdictions like Hong Kong and Singapore are tightening controls in response to global standards set by the Financial Action Task Force (FATF) and the rising complexity of financial crime, especially involving cross-border flows and digital assets. This means more investment in technology and personnel for continuous transaction monitoring and enhanced due diligence (EDD).
The compliance environment in Asia is getting tougher, fast. For example, the Hong Kong Monetary Authority (HKMA) has set a May 2026 deadline for Authorised Institutions to comply with the Supervisory Policy Manual module OR-2, requiring robust frameworks for operational resilience. While Manulife has a comprehensive Global AML/ATF Program, as confirmed in its April 2025 statement, the sheer volume of transactions in markets like Hong Kong, Japan, and Vietnam increases the operational cost and risk of regulatory failure. The penalties for non-compliance are severe, as demonstrated by the AUD 450 million fine levied against Crown Resorts in Australia for money laundering breaches, which sets a high precedent for enforcement in the Asia-Pacific region. You have to spend money on RegTech (regulatory technology) to keep up.
Class action litigation risk remains high, particularly related to historical variable annuity products in the US.
The risk of class action litigation, while managed, is a persistent legal factor due to the long-tail nature of insurance liabilities. This is particularly true for historical variable annuity products in the US, which contain complex guarantee features. While a similar class action in the US Federal Court for the Southern District of New York was dismissed previously, and Canadian class actions related to disclosure of market risk in segregated funds and variable annuities were settled for C$69 million (funded by insurance) years ago, the underlying risk remains. These products are inherently complex, making them a target for claims alleging misrepresentation of risk, fees, or suitability, especially to older clients.
The main exposure isn't just the settlement cost; it's the cost of defense and the distraction to management. Even successfully defending a major class action can cost tens of millions in legal fees and divert executive attention for years. The sheer volume of legacy annuity contracts means that any new regulatory interpretation or market event can trigger a wave of litigation, requiring Manulife to maintain substantial legal provisions and robust disclosure practices for all its John Hancock-branded products in the US.
Manulife Financial Corporation (MFC) - PESTLE Analysis: Environmental factors
You need to see the environmental factor not just as a risk to manage, but as a long-term shift in capital allocation, and Manulife Financial Corporation is actively repositioning its massive investment portfolio to capture this. The near-term challenge is accurately pricing the physical risks of climate change into your insurance and investment models.
Increased climate-related physical risks (e.g., severe weather) drive up property and casualty claims for their smaller P&C book, but also impact investment portfolio valuations.
Acute physical risks, like severe weather events, are already hitting Manulife's bottom line, even with its relatively smaller property and casualty (P&C) book. For example, the Q1 2025 financial results noted that core earnings were dampened by strengthened provisions, including a specific provision for the California wildfires. This shows that extreme weather is moving from a theoretical risk to a tangible, quarterly financial impact.
The bigger risk lies in the $800 billion+ general account portfolio, which is the company's own invested assets. While the total invested assets stood at C$445.7 billion as of March 31, 2025, the overall assets under management and administration (AUMA) is approximately C$1.6 trillion, demonstrating the scale of assets influenced by these risks. Physical risks, such as chronic sea-level rise or acute flooding, directly erode the value of real estate and infrastructure holdings within that portfolio, forcing a re-evaluation of long-duration asset valuations.
This is not just about P&C; it's about life and health, too. Manulife is actively researching the impact of physical climate risks on morbidity and mortality rates to inform product pricing, underwriting, and actuarial models, anticipating future shifts in claims severity and incidence.
Manulife's commitment to sustainable investing (ESG) influences asset allocation decisions across its $800 billion+ general account portfolio.
Manulife is using its own balance sheet to drive the transition, actively mapping a pathway to a net zero General Account investment portfolio by 2050. This is a huge undertaking, and it means ESG is no longer a peripheral consideration but a core investment thesis. The General Account currently manages over $42 billion in green investments, a portfolio focused on climate-positive areas like renewable energy, sustainable real estate, and timberland.
The company is also leveraging its expertise in natural capital. In 2024, Manulife closed the Manulife Forest Climate Fund LP, securing commitments totaling US$480 million to grow its forestry-based assets. This is a concrete example of asset allocation shifting toward nature-based solutions that offer both financial returns and carbon sequestration benefits.
Here's a quick look at the scale of the General Account's investment mix as of Q1 2025:
| Asset Class | Carrying Value (C$ Billions) | % of Total Invested Assets |
|---|---|---|
| Fixed Income Assets (Debt Securities, Mortgages, etc.) | ~356.6 | ~80% |
| Alternative Long-Duration Assets (Real Assets, Private Equity) | ~45.6 | ~10% |
| Real Estate Portfolio (Fair Value) | ~17.2 | ~4% |
| Total Invested Assets (General Account Proxy) | 445.7 | 100% |
Note: Figures are as of March 31, 2025.
Pressure from stakeholders to meet net-zero emissions targets forces divestment from high-carbon industries over the next decade.
The 2050 net-zero ambition for the investment portfolio is being implemented through a structured, sector-based approach, focusing first on high-emitting sectors like power generation. Manulife is prioritizing engagement over immediate divestment, but the pressure to meet targets is real and requires clear action. This is a defintely a transition risk.
Key near-term targets underscore this pressure:
- Achieve an Engagement Threshold Target of 70% of financed emissions to be net zero, net zero aligned, or subject to direct engagement by the end of 2025.
- Target a 50% reduction in Scope 1 and 2 Weighted Average Carbon Intensity (WACI) by 2030 for certain funds, using a December 31, 2019 baseline.
- Reduce absolute operational Scope 1 and 2 emissions by 40% by 2035 for assets they own and operate.
The company's approach is to steer companies toward decarbonization, but failure to show progress on these targets will inevitably lead to portfolio shifts and potential divestment from non-compliant, high-carbon holdings over the next decade.
New regulatory requirements for climate-related financial disclosures (TCFD) demand greater transparency in risk modeling.
Regulatory mandates are accelerating the need for transparency in climate risk. As an Internationally Active Insurance Group (IAIG) headquartered in Canada, Manulife is subject to the OSFI Guideline B-15: Climate Risk Management. This guideline, effective for IAIGs for their 2024 fiscal year end, requires the company to demonstrate a clear understanding and mitigation strategy for climate-related risks, including scenario analysis for severe, yet plausible, climate events.
Furthermore, the disclosure requirements in Guideline B-15's Chapter 2 have been updated to ensure interoperability with the new global standards from the International Sustainability Standards Board (ISSB) and the Canadian Sustainability Standards Board (CSSB). This regulatory alignment forces Manulife to standardize its risk modeling and reporting, moving beyond voluntary compliance with the Task Force on Climate-related Financial Disclosures (TCFD) to a mandatory, globally comparable framework. This means your risk management teams must now integrate climate scenarios directly into capital adequacy planning.
Disclaimer
All information, articles, and product details provided on this website are for general informational and educational purposes only. We do not claim any ownership over, nor do we intend to infringe upon, any trademarks, copyrights, logos, brand names, or other intellectual property mentioned or depicted on this site. Such intellectual property remains the property of its respective owners, and any references here are made solely for identification or informational purposes, without implying any affiliation, endorsement, or partnership.
We make no representations or warranties, express or implied, regarding the accuracy, completeness, or suitability of any content or products presented. Nothing on this website should be construed as legal, tax, investment, financial, medical, or other professional advice. In addition, no part of this site—including articles or product references—constitutes a solicitation, recommendation, endorsement, advertisement, or offer to buy or sell any securities, franchises, or other financial instruments, particularly in jurisdictions where such activity would be unlawful.
All content is of a general nature and may not address the specific circumstances of any individual or entity. It is not a substitute for professional advice or services. Any actions you take based on the information provided here are strictly at your own risk. You accept full responsibility for any decisions or outcomes arising from your use of this website and agree to release us from any liability in connection with your use of, or reliance upon, the content or products found herein.