
|
MoneyLion Inc. (ML): 5 FORCES Analysis [Nov-2025 Updated] |
Fully Editable: Tailor To Your Needs In Excel Or Sheets
Professional Design: Trusted, Industry-Standard Templates
Investor-Approved Valuation Models
MAC/PC Compatible, Fully Unlocked
No Expertise Is Needed; Easy To Follow
MoneyLion Inc. (ML) Bundle
You're looking at MoneyLion Inc. right now, trying to map out where the real pressure points are as they aim for that $660 million revenue forecast in 2025, managing a base of 20.4 million customers. Honestly, the FinTech space is brutal; it's a constant tug-of-war between powerful banking partners and price-sensitive users who can jump ship easily. We've mapped out the whole battlefield using Porter's Five Forces-from the high threat of substitutes like credit cards to the scale barrier created by their existing customer base-to give you a clear picture of the near-term risks and opportunities. Dig into the breakdown below; it shows exactly where MoneyLion Inc. has leverage and where they're definitely feeling the heat.
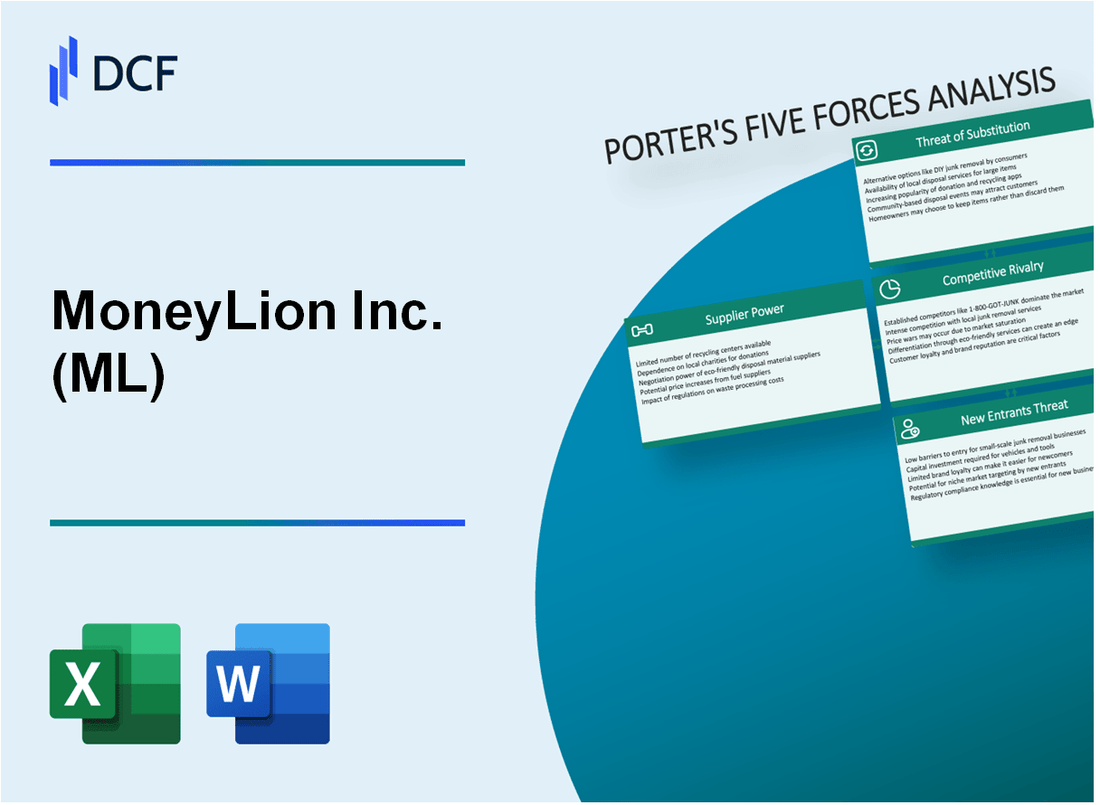
MoneyLion Inc. (ML) - Porter's Five Forces: Bargaining power of suppliers
You're assessing the power of MoneyLion Inc.'s key external providers, and honestly, for a fintech company, this is where the regulatory rubber meets the road. The power held by banking and core technology suppliers is definitely a major factor in MoneyLion's operating leverage.
Reliance on Pathward, N.A. for RoarMoney accounts creates concentration risk. Pathward, N.A. serves as the official bank of record for the RoarMoney℠ demand deposit account, meaning they actually hold the customer funds and issue the MoneyLion Debit Mastercard®. This deep integration means MoneyLion Inc. cannot easily switch core banking functions. The partnership, initially launched in 2020, was extended in September 2024 to run until 2029. That long-term commitment locks in a key supplier relationship for the foreseeable future.
Banking partners hold high power due to regulatory and charter requirements. MoneyLion Inc. is a financial technology company, not a bank itself. This structural dependency means Pathward, as a federally chartered bank and Member FDIC, dictates the compliance framework for deposit-holding services. You can see this power dynamic clearly when RoarMoney accounts show up as Pathward in external apps because Pathward is the custodian of funds.
Recent $70 million debt refinancing with SVB lowered capital cost, reducing funding supplier power. MoneyLion Inc. took action to mitigate the power of its debt suppliers in late 2024. They closed a $70 million loan facility with Silicon Valley Bank (SVB), a division of First-Citizens Bank & Trust Company. This new facility was used to repay in full the approximately $65.0 million aggregate principal amount outstanding under the existing loan facility. The result was a significant win: the cost of capital was lowered by approximately 550 basis points, and the debt maturity was extended to 2029. This move strengthened the balance sheet and reduced the immediate leverage of prior funding sources.
Technology and data providers are specialized, giving them moderate leverage. MoneyLion Inc. relies on specialized third parties for critical infrastructure, such as identity verification and data exchange. For instance, recent growth was supported by expanded partnerships with Nova Credit, TransUnion, and Plaid. While these are essential, the sheer volume of MoneyLion's user base might give them some negotiating leverage back.
The 1,200+ Enterprise Partner network diversifies the supply of marketplace offers. To counter reliance on any single product supplier, MoneyLion Inc. has built out its marketplace. As of the full year 2024 results, the ecosystem brought together offers from MoneyLion Inc. and its 1,300+ Enterprise Partner network. This scale helps diversify the supply side for the embedded finance marketplace.
Here's a quick look at the key supplier relationships and associated figures we see:
| Supplier Category | Key Partner/Metric | Associated Financial/Statistical Number | Impact on Power |
|---|---|---|---|
| Core Banking/Custody | Pathward, N.A. (Bank of Record) | Partnership extended until 2029 | High (Regulatory necessity) |
| Debt Financing | SVB Refinancing (Nov 2024) | $70 million new facility; repaid $65.0 million old debt | Reduced (Lowered cost of capital by 550 basis points) |
| Marketplace Offers | Enterprise Partner Network Size (FY 2024) | 1,300+ partners | Moderate (Diversification benefit) |
| Data/Verification Tech | Key Partnerships Mentioned | Plaid, Nova Credit, TransUnion | Moderate (Specialized services) |
The concentration risk with Pathward, N.A. remains a structural feature of the business model, but the debt refinancing shows management is actively working to improve terms with financial suppliers. Still, you can't run a bank-as-a-service model without a bank.
- RoarMoney account is provided by Pathward, N.A..
- MoneyLion is not an FDIC-insured institution.
- Total revenue for FY 2024 was $546 million.
- Total Customers grew to 20.4 million in FY 2024.
- Total Products grew to 34.1 million in FY 2024.
Finance: draft a sensitivity analysis on the cost of capital change from the 550 basis points reduction by Friday.
MoneyLion Inc. (ML) - Porter's Five Forces: Bargaining power of customers
For customers using a single product, like the Instacash advance, the bargaining power is quite high. You see, MoneyLion Inc. offers standard Instacash delivery at zero fees, though an optional Turbo fee applies for expedited service. This lack of a mandatory fee for the basic service means a customer can easily test the service and then switch to a competitor if a better, no-cost option appears tomorrow. The advances themselves are dispersed in small increments, often $100 at a time, which doesn't lock you in for a large commitment.
The market is crowded, which definitely amplifies this power. You have a high availability of direct competitors, including Chime, Dave, and Varo, all vying for the same consumer. When switching costs are minimal, the customer's ability to demand better terms or simply walk away is strong. Honestly, this is the nature of the fintech space for unbundled services.
However, MoneyLion Inc. counters this by pushing its ecosystem approach, which increases stickiness for multi-product users. The platform offers a substantial array of financial tools. As of December 31, 2024, customers had a choice of over 34.1 million total products on the platform. This breadth of offering is designed to keep you within the MoneyLion environment for more of your financial life.
Here's a quick look at the scale versus engagement metrics as of the end of fiscal year 2024:
| Metric | Value (As of Dec 31, 2024) |
| Total Customers | 20.4 million |
| Total Products | 34.1 million |
| Revenue Growth (FY 2024 vs FY 2023) | 29% |
Your target segment, often characterized by lower credit scores or limited financial history, is inherently price-sensitive. Customers in this space have less discretionary spending, so they demand low or no-fee products. MoneyLion Inc. addresses this directly with offerings like the RoarMoney℠ account, which has a $0 monthly administrative fee. Still, the company must remain vigilant about the cost structure of its premium add-ons, like the Credit Builder Plus membership at $19.99/month, because these fees can drive the most price-sensitive users away.
The sheer scale of the customer base, reaching 20.4 million Total Customers by the close of 2024, certainly gives MoneyLion Inc. leverage in negotiations with partners and in marketing efficiency. But, this scale is a double-edged sword. Management noted in their FY25 shareholder letter that difficulties in retaining existing customers remain a key risk factor. If you don't continuously deliver value across multiple products, that large base is susceptible to churn, defintely.
The bargaining power of customers is shaped by these factors:
- Low cost to switch for single-product users.
- Standard Instacash delivery has $0 fee.
- RoarMoney℠ has a $0 monthly administrative fee.
- High product count (34.1 million) drives platform stickiness.
- Customer base size of 20.4 million as of year-end 2024.
Finance: draft 13-week cash view by Friday.
MoneyLion Inc. (ML) - Porter's Five Forces: Competitive rivalry
You're looking at the competitive rivalry for MoneyLion Inc. right now, and honestly, it's a pressure cooker. The FinTech sector, especially the space occupied by neobanks and cash advance apps, is characterized by extremely high rivalry. You've got a crowded field fighting for the same digitally-native, often underbanked or underserved, consumer wallet.
The key rivals you need to track are definitely Chime, Dave, and Empower, but don't forget the sheer scale and deep pockets of traditional financial institutions that are rapidly digitizing their offerings. This intense competition means that any edge is crucial for survival and growth. MoneyLion's performance in 2024 shows they were definitely playing aggressively in this environment. They posted a record full-year 2024 revenue of $545.9 million, which represented a 29% year-over-year growth. That kind of top-line expansion in a mature segment signals a real fight for market share.
To give you a clearer picture of MoneyLion's operational aggression leading into the acquisition, look at these key growth figures from the end of fiscal year 2024:
- Full Year 2024 Revenue: $545.9 million
- Year-over-Year Revenue Growth (FY 2024): 29%
- Total Customers (FY 2024 End): 20.4 million
- Total Products (FY 2024 End): 34.1 million
- Total Originations (FY 2024 End): $3.1 billion
Here's a quick comparison of MoneyLion's 2024 growth against its operational scale:
| Metric | MoneyLion Inc. FY 2024 Value | Year-over-Year Growth |
|---|---|---|
| Total Revenue, Net | $545.9 million | 29% |
| Total Customers | 20.4 million | 46% |
| Total Products | 34.1 million | 48% |
| Total Originations | $3.1 billion | 38% |
Still, product differentiation remains a significant challenge for MoneyLion, particularly with core services. For basic offerings like Instacash advances-the small, often fee-based, short-term liquidity products-the features across competitors are largely commoditized. If you can get a cash advance in minutes from three different apps, the switching cost is low, meaning loyalty hinges more on fee structure or incidental features than on proprietary technology.
The pending acquisition by Gen Digital Inc. is the biggest factor altering this competitive landscape as of late 2025. MoneyLion stockholders approved the definitive agreement on April 10, 2025, and the deal was expected to complete on April 17, 2025. This move immediately changes MoneyLion's competitive dynamic. Once it becomes a subsidiary of Gen Digital, its scale will be bolstered by Gen Digital's existing user base-analysts noted the potential to cross-sell to Gen's 500 million subscribers. This transition means MoneyLion moves from competing as a standalone public entity to operating as a strategic, integrated component within a much larger digital freedom and security ecosystem, which definitely alters the competitive calculus for every other FinTech player.
MoneyLion Inc. (ML) - Porter's Five Forces: Threat of substitutes
The threat of substitutes for MoneyLion Inc.'s core offerings is substantial, stemming from established financial institutions and agile, specialized fintech competitors. You are competing not just on features, but on ingrained customer trust and the perceived cost of switching, which is often zero for many substitutes.
Traditional banks and credit unions directly substitute for the MoneyLion RoarMoney account and its credit builder loans. While MoneyLion ended the full year of 2024 with 20.4 million total customers, these customers have existing relationships with traditional providers that offer checking accounts without monthly fees. For credit building, traditional banks and credit unions offer secured credit cards or standard installment loans, which, despite potentially higher initial hurdles, carry the established security of a large institution. MoneyLion's Credit Builder loan APRs range from 5.99% APR to 29.99% APR, which must be weighed against the APRs offered by these legacy players.
For the Instacash advances, the threat comes from dedicated Earned Wage Access (EWA) competitors like Earnin. The U.S. EWA market was valued at USD 2.51 Billion in 2024, showing significant scale in this substitute category. As of October 2025, Earnin serves over 12,000 U.S. employers and processes about 1% of U.S. paychecks. This demonstrates a direct, high-volume substitution for on-demand pay features. Furthermore, a 2025 wage stress survey indicated that 73% of employees are living paycheck-to-paycheck, highlighting the massive underlying demand that substitutes are meeting.
Short-term credit needs are heavily substituted by credit cards and Buy Now, Pay Later (BNPL) services. While MoneyLion's total originations for the full year of 2024 reached $3.1 billion, credit cards offer revolving credit with established limits and rewards programs that MoneyLion's smaller credit products cannot match in scope. BNPL services, which are often integrated directly at the point of sale, offer interest-free financing for short durations, directly competing with the need for small, immediate cash advances.
Low-cost brokerage apps substitute for MoneyLion Active Investing. MoneyLion Active Investing promotes zero trading fees for stocks and ETFs. However, the broader investment landscape shows massive scale elsewhere; global Assets under Management (AUM) reached $147 trillion by the end of June 2025. Active management, which MoneyLion's product mirrors, is projected to account for $87.6 trillion of that global AUM by 2025. Apps like Robinhood compete on user experience and brand recognition among younger investors, often offering features like fractional shares with no minimum balance, similar to MoneyLion's offering which starts investing with as little as $1.
The threat is high because many substitutes are either free at the point of use or benefit from decades of established trust. You are fighting against the inertia of existing primary banking relationships and the zero-cost nature of many basic investment platforms. The market is fragmented, meaning a substitute exists for nearly every single product MoneyLion offers.
Here's a quick comparison of cost structures for key services:
| Service Category | MoneyLion Inc. Offering/Feature | Substitute Comparison Point | Associated Number/Cost |
|---|---|---|---|
| Credit Builder Loan APR | Range offered | Minimum APR for Credit Builder Loan | 5.99% APR |
| EWA Market Scale (US) | Instacash Advance | U.S. Earned Wage Access Market Value (2024) | USD 2.51 Billion |
| Brokerage Trading Cost | Active Investing | Trading Fees (Stocks/ETFs) | Zero commission fees |
| Customer Base Context | Total Customers (FY 2024 End) | Total Customers | 20.4 million |
| Credit Builder Membership Fee | Credit Builder Plus | Approximate Monthly Cost (Historical Context) | About $20 a month |
The competitive pressure is visible across the product suite:
- Traditional banks substitute for RoarMoney's core deposit functionality.
- EWA providers like Earnin directly substitute Instacash advances.
- Earnin processes approximately 1% of U.S. paychecks as of late 2025.
- Credit cards and BNPL services compete for short-term liquidity needs.
- Low-cost brokerages compete for the investment wallet share.
- Global AUM in active management, the segment MoneyLion targets, is projected to be $87.6 trillion by 2025.
Finance: draft 13-week cash view by Friday.
MoneyLion Inc. (ML) - Porter's Five Forces: Threat of new entrants
You're looking at the barriers for a new competitor trying to break into the space MoneyLion Inc. occupies. Honestly, the threat of new entrants is currently quite high, but it's complicated by the recent acquisition and the nature of regulated finance.
Regulatory hurdles and capital requirements for lending and banking are inherently high barriers to entry in the US financial sector. To offer a full suite of services like MoneyLion Inc. did, a new player needs significant compliance infrastructure and capital reserves to satisfy regulators, which immediately filters out many small startups. This isn't like launching a simple social media app; you are dealing with deposits and lending.
The operational necessity of a bank partner is a significant initial barrier. MoneyLion Inc. relied on its relationship with Pathward, N.A., Member FDIC, which serves as the official bank of record for its RoarMoney accounts. This partnership, which has been extended until 2029, provides the necessary regulatory wrapper and deposit insurance. A new entrant must secure a similar, trusted, and compliant sponsor bank, which is a process that takes time and capital, and banks are increasingly selective about who they partner with.
MoneyLion Inc.'s established user base creates a network effect barrier that new entrants must overcome. As of the end of fiscal year 2024, MoneyLion Inc. reported 20.4 million Total Customers. This scale allows for better data leverage, which feeds back into product personalization and marketplace value, making the platform stickier for existing users and more attractive to potential enterprise partners. Here's the quick math on the scale that was absorbed:
| Metric | MoneyLion Inc. (as of FYE 2024) | Gen Digital (as of FY25) |
|---|---|---|
| Total Customers | 20.4 million | Approximately 77 million |
| Annual Revenue (Approximate) | $546 million | Over $3.9 billion |
| Bank Partnership Term (Pathward) | Extended through 2029 | N/A (Acquired Entity) |
Still, the threat is not absolute. Low initial capital is needed for a single-feature app, like a basic cash advance service, which keeps the threat moderate at the very low end of the market. A startup could launch a narrow, unregulated service without a bank partner, but they would struggle to compete with the breadth of MoneyLion Inc.'s offerings.
The acquisition by Gen Digital Inc. significantly raises the barrier for new rivals looking to challenge the combined entity. Gen Digital, which finalized the acquisition of MoneyLion Inc. for approximately $1 billion in cash in April 2025, brings a much larger balance sheet and a massive existing user base of about 77 million customers. This integration means new entrants are not just competing with the former MoneyLion Inc.; they are competing against a diversified digital freedom giant with over $3.9 billion in FY25 revenue. This deep-pocketed backing allows for aggressive investment in technology and marketing that a startup simply cannot match.
The key barriers to entry now look like this:
- Regulatory compliance and charter access.
- Securing a long-term, stable bank sponsor.
- Matching the combined entity's 77 million customer reach.
- Funding the technology stack required for a 'super app.'
If onboarding a new customer costs a new entrant more than the $26.96 implied by MoneyLion's $546 million FY2024 revenue divided by its 20.4 million customers, churn risk rises fast.
Finance: draft a sensitivity analysis on the cost to acquire a customer vs. the combined entity's scale by next Tuesday.
Disclaimer
All information, articles, and product details provided on this website are for general informational and educational purposes only. We do not claim any ownership over, nor do we intend to infringe upon, any trademarks, copyrights, logos, brand names, or other intellectual property mentioned or depicted on this site. Such intellectual property remains the property of its respective owners, and any references here are made solely for identification or informational purposes, without implying any affiliation, endorsement, or partnership.
We make no representations or warranties, express or implied, regarding the accuracy, completeness, or suitability of any content or products presented. Nothing on this website should be construed as legal, tax, investment, financial, medical, or other professional advice. In addition, no part of this site—including articles or product references—constitutes a solicitation, recommendation, endorsement, advertisement, or offer to buy or sell any securities, franchises, or other financial instruments, particularly in jurisdictions where such activity would be unlawful.
All content is of a general nature and may not address the specific circumstances of any individual or entity. It is not a substitute for professional advice or services. Any actions you take based on the information provided here are strictly at your own risk. You accept full responsibility for any decisions or outcomes arising from your use of this website and agree to release us from any liability in connection with your use of, or reliance upon, the content or products found herein.