
|
Maui Land & Pineapple Company, Inc. (MLP) DCF Valuation |
Fully Editable: Tailor To Your Needs In Excel Or Sheets
Professional Design: Trusted, Industry-Standard Templates
Investor-Approved Valuation Models
MAC/PC Compatible, Fully Unlocked
No Expertise Is Needed; Easy To Follow
Maui Land & Pineapple Company, Inc. (MLP) Bundle
Gain insights into your Maui Land & Pineapple Company, Inc. (MLP) valuation analysis with our state-of-the-art DCF Calculator! Preloaded with accurate MLP data, this Excel template enables you to adjust forecasts and assumptions, allowing for precise calculations of Maui Land & Pineapple Company's intrinsic value.
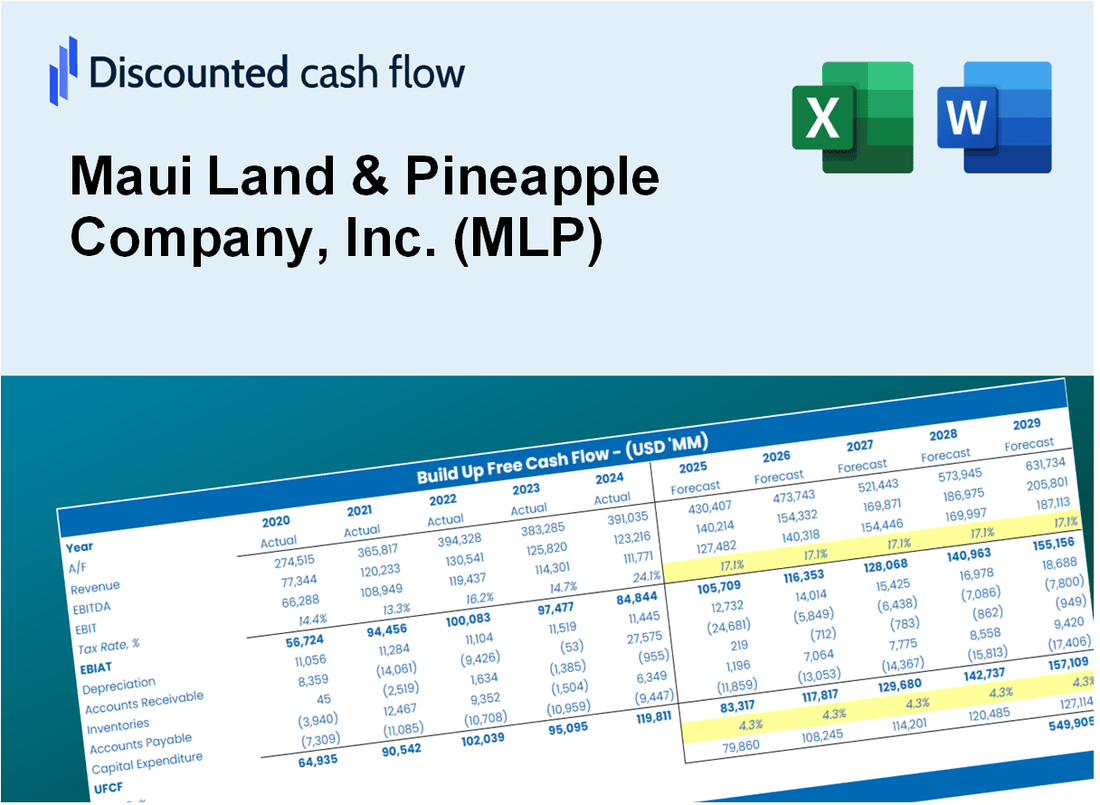
Discounted Cash Flow (DCF) - (USD MM)
| Year | AY1 2020 |
AY2 2021 |
AY3 2022 |
AY4 2023 |
AY5 2024 |
FY1 2025 |
FY2 2026 |
FY3 2027 |
FY4 2028 |
FY5 2029 |
|---|---|---|---|---|---|---|---|---|---|---|
| Revenue | 7.5 | 12.4 | 21.0 | 9.3 | 11.6 | 14.5 | 18.2 | 22.9 | 28.8 | 36.1 |
| Revenue Growth, % | 0 | 65.03 | 68.45 | -55.68 | 24.5 | 25.57 | 25.57 | 25.57 | 25.57 | 25.57 |
| EBITDA | -1.2 | -1.8 | 2.8 | -1.5 | -5.9 | -2.4 | -3.0 | -3.8 | -4.8 | -6.0 |
| EBITDA, % | -15.25 | -14.42 | 13.54 | -16.21 | -50.77 | -16.62 | -16.62 | -16.62 | -16.62 | -16.62 |
| Depreciation | 10.1 | 10.8 | 11.4 | .8 | .7 | 7.4 | 9.3 | 11.7 | 14.7 | 18.5 |
| Depreciation, % | 133.85 | 86.84 | 54.17 | 8.45 | 6.25 | 51.14 | 51.14 | 51.14 | 51.14 | 51.14 |
| EBIT | -11.2 | -12.6 | -8.5 | -2.3 | -6.6 | -9.4 | -11.8 | -14.8 | -18.5 | -23.3 |
| EBIT, % | -149.1 | -101.26 | -40.62 | -24.66 | -57.03 | -64.46 | -64.46 | -64.46 | -64.46 | -64.46 |
| Total Cash | .9 | 5.6 | 10.9 | 8.4 | 9.5 | 8.2 | 10.3 | 12.9 | 16.2 | 20.3 |
| Total Cash, percent | .0 | .0 | .0 | .0 | .0 | .0 | .0 | .0 | .0 | .0 |
| Account Receivables | 1.4 | 1.1 | .9 | 1.2 | 5.0 | 2.5 | 3.2 | 4.0 | 5.0 | 6.3 |
| Account Receivables, % | 18.06 | 8.86 | 4.26 | 12.55 | 43.37 | 17.42 | 17.42 | 17.42 | 17.42 | 17.42 |
| Inventories | .0 | .0 | .0 | .0 | .0 | .0 | .0 | .0 | .0 | .0 |
| Inventories, % | 0 | 0 | 0 | 0 | 0 | 0 | 0 | 0 | 0 | 0 |
| Accounts Payable | .9 | .6 | .6 | 1.2 | 2.3 | 1.5 | 1.9 | 2.4 | 3.0 | 3.7 |
| Accounts Payable, % | 11.92 | 4.66 | 2.81 | 12.42 | 20.07 | 10.38 | 10.38 | 10.38 | 10.38 | 10.38 |
| Capital Expenditure | -.1 | .0 | .0 | -.6 | -1.9 | -.7 | -.9 | -1.1 | -1.4 | -1.8 |
| Capital Expenditure, % | -1.07 | -0.23306 | -0.15744 | -6.65 | -16.18 | -4.86 | -4.86 | -4.86 | -4.86 | -4.86 |
| Tax Rate, % | 0 | 0 | 0 | 0 | 0 | 0 | 0 | 0 | 0 | 0 |
| EBITAT | -11.2 | -12.6 | -8.5 | -2.3 | -6.6 | -9.4 | -11.8 | -14.8 | -18.5 | -23.3 |
| Depreciation | ||||||||||
| Changes in Account Receivables | ||||||||||
| Changes in Inventories | ||||||||||
| Changes in Accounts Payable | ||||||||||
| Capital Expenditure | ||||||||||
| UFCF | -1.7 | -1.9 | 3.0 | -1.8 | -10.4 | -1.0 | -3.6 | -4.5 | -5.6 | -7.1 |
| WACC, % | 6.95 | 6.95 | 6.95 | 6.95 | 6.95 | 6.95 | 6.95 | 6.95 | 6.95 | 6.95 |
| PV UFCF | ||||||||||
| SUM PV UFCF | -17.1 | |||||||||
| Long Term Growth Rate, % | 2.00 | |||||||||
| Free cash flow (T + 1) | -7 | |||||||||
| Terminal Value | -146 | |||||||||
| Present Terminal Value | -104 | |||||||||
| Enterprise Value | -121 | |||||||||
| Net Debt | -4 | |||||||||
| Equity Value | -118 | |||||||||
| Diluted Shares Outstanding, MM | 20 | |||||||||
| Equity Value Per Share | -6.01 |
What You Will Get
- Real MLP Financial Data: Pre-filled with Maui Land & Pineapple Company’s historical and projected data for precise analysis.
- Fully Editable Template: Modify key inputs like revenue growth, WACC, and EBITDA % with ease.
- Automatic Calculations: See MLP’s intrinsic value update instantly based on your changes.
- Professional Valuation Tool: Designed for investors, analysts, and consultants seeking accurate DCF results.
- User-Friendly Design: Simple structure and clear instructions for all experience levels.
Key Features
- Customizable Growth Assumptions: Adjust key factors such as land development rates, revenue projections, and operational costs.
- Instant DCF Analysis: Automatically computes intrinsic value, NPV, and additional financial metrics.
- Industry-Leading Precision: Leverages Maui Land & Pineapple Company, Inc.'s (MLP) actual financial data for accurate valuation results.
- Effortless Scenario Testing: Evaluate various scenarios and analyze results with ease.
- Efficiency Booster: Streamlines the valuation process, removing the need for intricate model creation.
How It Works
- Download the Template: Gain immediate access to the Excel-based MLP DCF Calculator.
- Input Your Assumptions: Modify the yellow-highlighted cells for growth rates, WACC, margins, and other variables.
- Instant Calculations: The model automatically recalculates Maui Land & Pineapple Company’s intrinsic value.
- Test Scenarios: Experiment with various assumptions to assess potential changes in valuation.
- Analyze and Decide: Utilize the results to inform your investment or financial decisions.
Why Choose This Calculator?
- User-Friendly Interface: Perfect for both novices and seasoned professionals.
- Customizable Inputs: Adjust parameters to suit your specific analysis needs.
- Real-Time Insights: Monitor immediate changes to Maui Land & Pineapple Company, Inc.'s (MLP) valuation as you tweak inputs.
- Preloaded Data: Comes equipped with Maui Land & Pineapple Company, Inc.'s (MLP) latest financial information for swift evaluations.
- Endorsed by Experts: Utilized by investors and analysts for making well-informed decisions.
Who Should Use This Product?
- Individual Investors: Make informed decisions about buying or selling Maui Land & Pineapple Company, Inc. (MLP) stock.
- Financial Analysts: Streamline valuation processes with ready-to-use financial models specific to Maui Land & Pineapple Company, Inc. (MLP).
- Consultants: Deliver professional valuation insights regarding Maui Land & Pineapple Company, Inc. (MLP) to clients quickly and accurately.
- Business Owners: Understand how companies like Maui Land & Pineapple Company, Inc. (MLP) are valued to guide your own business strategy.
- Finance Students: Learn valuation techniques using real-world data and scenarios related to Maui Land & Pineapple Company, Inc. (MLP).
What the Template Contains
- Operating and Balance Sheet Data: Pre-filled Maui Land & Pineapple Company, Inc. (MLP) historical data and forecasts, including revenue, EBITDA, EBIT, and capital expenditures.
- WACC Calculation: A dedicated sheet for Weighted Average Cost of Capital (WACC), featuring parameters like Beta, risk-free rate, and share price.
- DCF Valuation (Unlevered and Levered): Editable Discounted Cash Flow models illustrating intrinsic value with comprehensive calculations.
- Financial Statements: Pre-loaded financial statements (annual and quarterly) to facilitate analysis.
- Key Ratios: Includes profitability, leverage, and efficiency ratios for Maui Land & Pineapple Company, Inc. (MLP).
- Dashboard and Charts: Visual summary of valuation outputs and assumptions to simplify result analysis.
Disclaimer
All information, articles, and product details provided on this website are for general informational and educational purposes only. We do not claim any ownership over, nor do we intend to infringe upon, any trademarks, copyrights, logos, brand names, or other intellectual property mentioned or depicted on this site. Such intellectual property remains the property of its respective owners, and any references here are made solely for identification or informational purposes, without implying any affiliation, endorsement, or partnership.
We make no representations or warranties, express or implied, regarding the accuracy, completeness, or suitability of any content or products presented. Nothing on this website should be construed as legal, tax, investment, financial, medical, or other professional advice. In addition, no part of this site—including articles or product references—constitutes a solicitation, recommendation, endorsement, advertisement, or offer to buy or sell any securities, franchises, or other financial instruments, particularly in jurisdictions where such activity would be unlawful.
All content is of a general nature and may not address the specific circumstances of any individual or entity. It is not a substitute for professional advice or services. Any actions you take based on the information provided here are strictly at your own risk. You accept full responsibility for any decisions or outcomes arising from your use of this website and agree to release us from any liability in connection with your use of, or reliance upon, the content or products found herein.