
|
Nasdaq, Inc. (NDAQ): PESTLE Analysis [Nov-2025 Updated] |
Fully Editable: Tailor To Your Needs In Excel Or Sheets
Professional Design: Trusted, Industry-Standard Templates
Investor-Approved Valuation Models
MAC/PC Compatible, Fully Unlocked
No Expertise Is Needed; Easy To Follow
Nasdaq, Inc. (NDAQ) Bundle
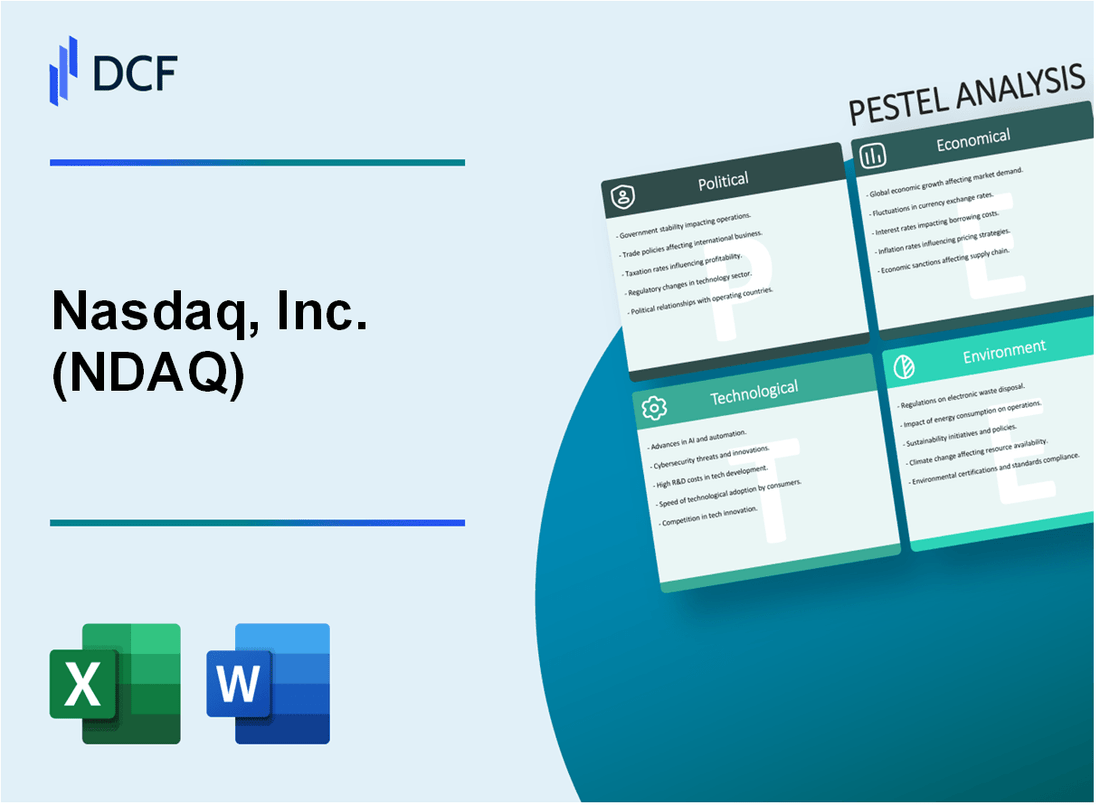
You're looking for a clear-eyed view of Nasdaq, Inc. (NDAQ) as we head into late 2025, and honestly, the landscape is complex. It's not just about trading volume anymore; it's about their transformation into a financial technology powerhouse, which is why the external forces are shifting the ground beneath them. We need to look beyond the ticker to the macro-environmental factors-Political, Economic, Sociological, Technological, Legal, and Environmental-to map the near-term risks and opportunities, so you can make a smarter strategic decision.
Political Landscape: Regulatory Headwinds and Geopolitics
The political environment is creating a compliance drag, mostly from Washington. Increased regulatory scrutiny from the SEC on market data fees is a persistent headache, plus the US government's focus on anti-trust and competition in exchange services could limit future growth through acquisition or pricing power. We also see pressure for mandatory climate-related financial disclosures, which forces Nasdaq, Inc. to evolve its listing requirements and data products. Geopolitical tensions still impact cross-border listing activity, making it harder to attract high-profile international IPOs. The regulatory cost of doing business is defintely rising.
Economic Environment: The Recurring Revenue Shield
Higher interest rates are slowing capital markets activity, which hurts the core IPO volume business. However, the shift to a recurring revenue model, largely post-Adenza acquisition, provides a crucial revenue stability buffer. Analyst estimates for the full 2025 fiscal year revenue hover around $5.274 billion, with non-GAAP operating expenses guided between $2,295 million and $2,335 million. This Financial Technology segment's Annualized Recurring Revenue (ARR) hit $2.9 billion as of Q2 2025, showing the value of that pivot. Global inflation pressures increase operating costs, but the strong US dollar affects revenue from international market technology sales, creating a natural hedge in some areas. The Adenza deal is paying off in predictable revenue.
Sociological Shifts: ESG and the Retail Investor
The public is driving financial change, specifically through two channels. First, there's growing demand for sustainable investing (ESG) data and products, forcing Nasdaq, Inc. to create new index and data services. Second, increased retail investor participation is driving demand for fractional shares and new listings, keeping the market vibrant even when institutional IPOs slow. There's also a strong focus on diversity in corporate boards and executive leadership for listed companies, which Nasdaq, Inc. must enforce through its listing rules. Finally, the talent wars for specialized software engineers and cybersecurity experts mean higher payroll costs. You need to pay up for FinTech talent.
Technological Imperatives: AI, Cloud, and Adenza
Technology is the core of Nasdaq, Inc.'s new identity. The large-scale integration of the Adenza platform into the Financial Technology segment is the single biggest operational focus, aimed at creating a unified risk and regulatory software offering. Significant investment in cloud migration and distributed ledger technology (DLT)-a decentralized database managed by multiple participants-is underway to boost speed and resilience. Plus, the use of Artificial Intelligence (AI) for market surveillance and fraud detection is becoming standard practice, but the need to defend against increasingly sophisticated cyberattacks on trading systems is a constant, expensive threat. Innovation is now a non-negotiable cost.
Legal Framework: Compliance and Data Risk
Compliance costs are rising due to new SEC rules on short selling and market structure, which means more spending on legal and technology teams. Ongoing legal risks related to data privacy and cross-border data transfer regulations, like GDPR in Europe, are a major concern for a global data provider. Nasdaq, Inc. also faces litigation risk from competitors over intellectual property in trading technology, especially as new exchanges like the Texas Stock Exchange plan to launch. Enforcement of listing standards, particularly around minimum public float requirements, keeps their Capital Access Platforms segment in the legal spotlight. Every new product gets a legal review.
Environmental Focus: The Green Index Opportunity
While not a traditional exchange risk, the environmental factor presents a clear opportunity. There is increased demand for transparency on carbon footprint from listed companies, which Nasdaq, Inc. can monetize through data products. The company's own commitment to achieving carbon neutrality goals sets a good example for its listed companies. The biggest opportunity lies in creating new ESG-focused indices and derivatives products, tapping into the multi-trillion-dollar sustainable investing market. Physical climate risk affecting data center operations is a long-term concern, but it's manageable today. Finance: track the ARR contribution from the Financial Technology segment monthly.
Nasdaq, Inc. (NDAQ) - PESTLE Analysis: Political factors
Increased regulatory scrutiny from the SEC on market data fees.
You need to know that the regulatory pressure on exchange fees is a constant, low-grade political risk for Nasdaq, Inc. The core issue remains whether the fees charged for proprietary market data are fair and reasonable, especially given the exchange's quasi-monopolistic position. While exchanges have historically won some court battles against the Securities and Exchange Commission (SEC) on this, the scrutiny hasn't stopped.
In 2025, Nasdaq, Inc. initiated a phased-in inflationary adjustment to its market data fees for specific Equities and Options products, starting January 1, 2025. This move, which requires SEC approval, is benchmarked against a subset of the Producer Price Index (PPI) for Data Processing. Here's the quick math: the Data Processing PPI has increased by approximately 12% over the last decade, and Nasdaq, Inc. is using this as justification for its fee adjustments. This action keeps the issue squarely in the SEC's political spotlight, forcing the regulator to either approve the increase or challenge the justification, which could lead to protracted legal battles.
Also, the cost of the Consolidated Audit Trail (CAT), a massive, contentious trading database, remains a political football. The CAT's projected cost for 2025 was around $196 million, but the SEC, in September 2025, moved to cut that expense by $20 million to $27 million through regulatory exemptions. This cost-cutting alleviates some financial burden on exchanges like Nasdaq, Inc. and other market participants, but the political debate over who pays for market surveillance continues.
Geopolitical tensions impacting cross-border listing activity.
Geopolitical tensions, particularly between the U.S. and China, are directly translating into stricter listing policies, which is a political headwind for Nasdaq, Inc.'s listing revenue. The U.S. government's focus on national security, audit access for foreign companies, and protecting U.S. investors from foreign risk has forced the exchange to act.
In September 2025, Nasdaq, Inc. proposed significant enhancements to its listing standards specifically targeting companies from high-risk jurisdictions. The most concrete action is a new requirement for new listings of companies principally operating in China to have a minimum public offering proceeds of $25 million. This is a clear political response to de-risk the exchange for investors.
The impact is a higher barrier to entry for a key source of cross-border listings. This new requirement is significantly higher than the new general minimum public float of $15 million for new listings under the net income standard. It's a defintely a trade-off: you lose some potential listing volume, but you enhance market integrity and investor protection, which is a political necessity in this climate.
US government focus on anti-trust and competition in exchange services.
The political climate around anti-trust is shifting toward a more traditional, but still aggressive, enforcement model in 2025, which keeps the major exchange operators like Nasdaq, Inc. under a competitive microscope. While the primary focus of the Department of Justice (DOJ) and Federal Trade Commission (FTC) has been on Big Tech, the core issue of market concentration in exchange services remains a political vulnerability.
The biggest near-term competition signal is the regulatory approval of new entrants. For example, the regulatory approval of the Texas Stock Exchange (TXSE) in October 2025 was immediately viewed by analysts as a signal of 'potentially meaningful competition' for both Nasdaq, Inc. and the New York Stock Exchange. This political willingness to approve new exchange models creates competition at the regulatory level, even if the new exchanges take years to scale.
The exchange business model is built on network effects, but the political environment demands that the DOJ and other regulators ensure no single entity is stifling innovation or charging supracompetitive prices. The continuous scrutiny of market data fees is, in itself, an anti-trust issue by another name.
- Monitor new exchange approvals to gauge political appetite for competition.
- Expect continued regulatory challenges to any fee increases for core services.
- Prepare for potential DOJ inquiries into AI and algorithmic pricing practices.
Pressure for mandatory climate-related financial disclosures.
The political landscape for mandatory climate disclosures saw a major reversal in 2025, creating a patchwork of rules that Nasdaq, Inc.'s listed companies must navigate. In March 2025, the SEC voted to end its defense of the final climate-related disclosure rules, effectively putting the federal mandate on hold following months of litigation and a voluntary stay.
This political shift at the federal level does not, however, eliminate the pressure. It simply shifts the focus to state and international jurisdictions. This is a crucial distinction for a global exchange operator:
| Jurisdiction | Regulation Status (2025) | Impact on Nasdaq-Listed Companies |
|---|---|---|
| U.S. Federal (SEC) | Defense of mandatory rules abandoned (March 2025); rules stayed. | Reduced immediate compliance burden for U.S. disclosures. |
| California (SB 253 & SB 261) | SB 253 (GHG reporting) remains in effect; SB 261 (climate risk reports) faces injunction. | Large companies must still prepare for state-level reporting, starting with GHG emissions. |
| European Union (CSRD) | Corporate Sustainability Reporting Directive (CSRD) is in force. | U.S.-based, Nasdaq-listed companies with significant EU operations must comply with the EU's extensive disclosure requirements. |
The political pressure for transparency is not gone; it is simply decentralized. Nasdaq, Inc. must continue to offer compliance and Environmental, Social, and Governance (ESG) solutions to its listed companies to help them manage this complex, multi-jurisdictional regulatory environment. The exchange's role is now to help companies align with global frameworks, like the Task Force on Climate-related Financial Disclosures (TCFD), even without a strong U.S. federal push.
Nasdaq, Inc. (NDAQ) - PESTLE Analysis: Economic factors
Higher interest rates impact IPO volume, slowing capital markets activity.
You'd expect the high interest rate environment to crush the Initial Public Offering (IPO) market, but Nasdaq's 2025 performance shows a surprising resilience. While the Federal Reserve held its policy rate at a high range-around 4.25% to 4.50% in Q1 2025-the market saw a significant rebound in listings.
Higher rates increase the cost of capital, which usually makes private companies less eager to go public, but the first half of 2025 was the strongest period for listings since 2021. Nasdaq welcomed 142 IPOs, raising a total of $19.2 billion in the first six months of the year. This suggests that while the risk of a high-rate slowdown remains, the market's appetite for high-growth tech and biotech companies listed on Nasdaq has been strong enough to overcome that headwind, especially with market expectations for eventual rate cuts later in 2025.
The capital raised on Nasdaq in the first half of 2025 was more than double the capital raised on its primary U.S. competitor, demonstrating its market dominance even with economic uncertainty.
Shift to recurring revenue model post-Adenza acquisition provides revenue stability.
The most important economic shift for Nasdaq is its transformation from a transaction-heavy exchange to a technology and solutions provider, a strategy accelerated by the Adenza acquisition. This move drastically increases the share of predictable, recurring revenue, shielding the company from the volatility of the IPO and trading markets.
Here's the quick math on stability: In the second quarter of 2025, Nasdaq's Annualized Recurring Revenue (ARR)-the predictable subscription income-reached $2.9 billion, representing a strong 10% increase over the second quarter of 2024. Critically, the high-margin Annualized Software as a Service (SaaS) revenue grew even faster, up 13% year-over-year, and now accounts for 37% of that total ARR.
The Solutions business, which includes the Adenza platform for risk management and regulatory compliance, is projected to contribute approximately 77% of the group's total revenue, making Nasdaq defintely more of a software company than an exchange.
| Metric | Q2 2025 Value | YoY Growth (Q2 2024 to Q2 2025) |
|---|---|---|
| Annualized Recurring Revenue (ARR) | $2.9 billion | 10% |
| Annualized SaaS Revenue Growth | N/A (Represents 37% of ARR) | 13% |
| Financial Technology Revenue | $464 million | 10% |
Global inflation pressures increase operating costs, impacting margins.
Inflation is a real factor, and it hits Nasdaq primarily through operating expenses. The cost of doing business-especially attracting and retaining top-tier talent in technology-is rising globally. In the second quarter of 2025, the company's non-GAAP operating expenses totaled $585 million, an increase of 9% compared to the prior year period.
This cost growth is largely driven by higher compensation and benefits, plus continued investment in technology and people to fuel long-term growth and integrate the Adenza acquisition. For the full year, Nasdaq updated its 2025 non-GAAP operating expense guidance to a range of $2,295 million to $2,335 million. Managing this cost creep is critical, but the higher expenses are also a sign of continued strategic investment in the high-growth Solutions segments.
Strong US dollar affects revenue from international market technology sales.
For a global technology company like Nasdaq, currency volatility is a constant economic headwind. A strong US dollar makes the company's technology and data services more expensive for international clients paying in local currencies, which can suppress reported revenue when translated back into dollars.
While the dollar's path has been volatile in 2025, Nasdaq specifically cited the impact of foreign exchange rates as a factor in its updated 2025 non-GAAP operating expense guidance, which was adjusted to a range of $2,295 million to $2,335 million. The company noted that the negative impact from foreign exchange on operating expenses is generally offset in net revenue, but this constant currency fluctuation introduces a layer of complexity for international sales of market technology and index products.
The reality is, currency translation risk is a permanent feature of their business model, especially as they expand technology sales to exchanges and financial institutions outside the U.S.
- Monitor the US Dollar Index: A strengthening dollar makes international sales harder.
- Focus on local currency pricing: Helps stabilize demand for Market Technology sales.
- Hedge foreign exchange exposure: A necessary financial defense against volatility.
Nasdaq, Inc. (NDAQ) - PESTLE Analysis: Social factors
Growing demand for sustainable investing (ESG) data and products.
The social pressure for corporations to demonstrate positive environmental, social, and governance (ESG) impact is no longer a niche trend; it's a core driver of capital allocation. This is a massive opportunity for Nasdaq, Inc. because it shifts the focus from simple transaction processing to complex data and technology solutions.
Retail investor interest in ESG is accelerating, with participation growing by an estimated 18% year-over-year in 2025 alone. Institutional investors, like BlackRock, also continue to integrate ESG into their stewardship guidelines, which drives demand for high-quality, standardized data. Nasdaq capitalizes on this through its Solutions segment, which includes its Data & Index products.
Here's the quick math: Nasdaq's Solutions quarterly revenue surpassed $1.0 billion for the first time in the third quarter of 2025, with total Annualized Recurring Revenue (ARR) reaching $3.0 billion. This growth is defintely bolstered by its suite of sustainability-focused products, which provide the tools investors need.
- Nasdaq Sustainable Bond Network: Connects issuers with investors for green and social bonds.
- Sustainability Data Hub: Offers comprehensive ESG data sets via Nasdaq Data Link.
- Green Equity Indexes: Provides a family of environmental indexes for structured products.
- Nasdaq Metrio: A software solution for corporate ESG data collection and reporting.
Increased retail investor participation driving demand for fractional shares and new listings.
The democratization of finance through mobile trading apps and commission-free brokerage accounts has fundamentally changed market dynamics. Retail investors are now a major force, and the exchange must cater to their preferences, particularly the demand for fractional shares (the ability to buy a portion of a single, expensive stock) and direct access to Initial Public Offerings (IPOs).
As of 2025, retail investors account for approximately 20.5% of daily U.S. equity market volume, a substantial and consistent increase from prior years. This cohort traded a record $6.6 trillion worth of equities in the first half of 2025, according to Nasdaq data. This immense volume directly benefits Nasdaq's Market Services division, which handles trade execution and clearing.
The retail focus on high-growth, high-profile technology stocks-many of which are Nasdaq-listed-also creates a powerful incentive for companies to choose Nasdaq for their new listings. This retail-driven momentum is a key competitive advantage for the exchange.
| Retail Investor Metric (2025) | Value/Amount | Implication for Nasdaq |
|---|---|---|
| Share of Daily U.S. Equity Trading Volume | ~20.5% | Drives high transaction volume for Market Services. |
| Equities Traded (H1 2025) | $6.6 trillion | Demonstrates sustained, high-level engagement and liquidity. |
| Mobile App Trades Globally | 75% | Validates the need for high-speed, reliable trading technology. |
Focus on diversity in corporate boards and executive leadership for listed companies.
While the social expectation for diverse leadership remains strong, the regulatory landscape for Nasdaq-listed companies has shifted in 2025. In December 2024, the U.S. Court of Appeals for the Fifth Circuit vacated the Nasdaq board diversity rules, which had required listed companies to have, or explain why they did not have, a minimum number of diverse directors by deadlines like December 31, 2025.
What this estimate hides is that the social and institutional pressure has not disappeared. Major institutional investors, including BlackRock and Vanguard, continue to maintain their own proxy voting policies that favor board diversity. So, while the mandatory exchange rule is gone, the market expectation remains a powerful, voluntary compliance factor for companies seeking capital and favorable shareholder votes. Nasdaq must continue to provide tools like Nasdaq Boardvantage to help companies manage governance and disclosure, even without a formal rule.
Talent wars for specialized software engineers and cybersecurity experts.
As Nasdaq transforms into a leading technology platform-with Solutions revenue surpassing Market Services revenue-it increasingly competes with major tech firms for specialized talent. The 'talent war' for software engineers, cloud architects, and especially cybersecurity experts is a critical social factor impacting operating expenses and innovation capacity.
To attract and retain this talent in 2025, Nasdaq must offer highly competitive compensation packages. For a Nasdaq Software Engineer in the U.S., the average annual pay is approximately $147,524 as of November 2025, with the median total compensation package reaching $169,239, including stock and bonuses.
Cybersecurity is even more intense. The estimated total pay for cybersecurity jobs in the U.S. is $150,726 per year, and specialized roles like experienced product security engineers can command up to $250,000 annually. This high-cost environment is a necessary investment for Nasdaq, whose core business relies on the integrity and speed of its trading and data systems.
The cost of a breach or system failure is far greater than the cost of a top-tier security team. One clean one-liner: Pay for the best defense or pay for the fallout.
Nasdaq, Inc. (NDAQ) - PESTLE Analysis: Technological factors
Large-scale integration of the Adenza platform into Financial Technology segment
The $10.5 billion acquisition of Adenza, completed in 2023, is the single largest technological pivot for Nasdaq, Inc., fundamentally reshaping the Financial Technology (Fintech) segment. This move instantly created a financial technology powerhouse by combining Nasdaq's market infrastructure and surveillance tools with Adenza's mission-critical risk management and regulatory reporting software (AxiomSL and Calypso).
The near-term focus for the 2025 fiscal year is on realizing the immediate financial benefits of this integration. Here's the quick math: Nasdaq expects to achieve $80 million of annual run-rate net expense synergies by the end of the second year following the acquisition, which lands squarely in the 2025 timeframe. Plus, the combined entity is positioned to boost Nasdaq's Annualized Recurring Revenue (ARR) as a percentage of total revenue to approximately 60%, which is a huge step toward becoming a pure-play software-as-a-service (SaaS) provider.
The real opportunity, though, is the long-term cross-sell potential. They are targeting $100 million in revenue synergies over the long term, driven by selling the new, holistic suite of products to a now-expanded client base of over 3,800 financial institutions. That's how you defintely unlock value.
Significant investment in cloud migration and distributed ledger technology (DLT)
Nasdaq's multi-year partnership with Amazon Web Services (AWS) to migrate its North American markets to the cloud is a critical foundation for its future scalability and product offerings. The goal is simple: migrate core trading systems to a hybrid cloud model to boost performance and resilience.
The results from the migration of its largest options exchange are clear, showing an up to 10% performance improvement in round-trip latency, which is massive in high-frequency trading. This cloud-enabled infrastructure can already handle a throughput of more than 36 billion messages a day on its largest options exchange, and a total of 400 billion messages across the entire trading complex and surrounding systems. This kind of scale is non-negotiable for a global exchange operator.
On the innovation front, Distributed Ledger Technology (DLT), or blockchain, is moving from a concept to a concrete product. In September 2025, Nasdaq filed a Form 19b-4 with the SEC, proposing rule changes that would allow the trading of equity securities and exchange-traded products (ETPs) in "tokenized form" on its exchange. This action directly addresses the industry-wide trend where 71% of financial firms are making major investments in DLT, seeing it as a way to modernize settlement and custody.
The cloud migration is also key to meeting the company's strategic financial goal:
- SaaS ARR Target by 2025: greater than 40% of annualized recurring revenue.
Use of Artificial Intelligence (AI) for market surveillance and fraud detection
The sophistication of market manipulation schemes is rising, so Nasdaq is using Artificial Intelligence (AI) to fight fire with fire. Their market surveillance platform, which serves 50 exchanges and 20 international regulators globally, has been significantly enhanced with advanced AI capabilities.
This isn't just a buzzword; it's a proven tool. A pilot program completed in 2025 with the Capital Markets Authority of Saudi Arabia demonstrated an 80% accuracy rate in identifying complex pump-and-dump schemes in a historical sample set, far exceeding traditional detection methods. This AI is embedded across the entire investigation lifecycle-from anomaly detection to regulatory review-to reduce false positives and accelerate enforcement.
This technology is a core revenue driver in the Fintech segment, and Nasdaq plans to offer these new AI-enhanced capabilities to all market surveillance platform customers starting in Q4 2025. It's a compelling product, plus it reinforces Nasdaq's role as a guardian of market integrity.
Need to defend against increasingly sophisticated cyberattacks on trading systems
The financial services industry is a prime target, and the threat landscape is evolving faster than ever. Cybercrime is projected to cost the world an astronomical $10.5 trillion annually by the end of 2025, making robust defense a strategic necessity, not just an IT cost.
For a systemic operator like Nasdaq, the risk is existential. The average cost of a data breach rose to $4.88 million in 2024, a 10% increase from the prior year, driven by business disruption and post-breach recovery efforts. The attacks are increasingly sophisticated, leveraging the same technology Nasdaq uses for defense:
- AI-Weaponization: Malicious actors are using generative AI to create hyper-realistic phishing and deepfake social engineering campaigns.
- Ransomware: Persistent and financially devastating attacks, often leveraging Ransomware as a Service (RaaS) models.
- Supply Chain Attacks: Targeting third-party vendors to gain access to core systems.
While Nasdaq's specific 2025 security spending is sensitive, the global market response is clear: worldwide cybersecurity spending is projected to surge past $210 billion in 2025. Nasdaq must maintain a multi-layered defense posture that includes its own AI-powered security tools to protect its core matching engines and the vast data sets it manages.
| Technological Factor | 2025 Financial/Operational Impact | Strategic Action |
|---|---|---|
| Adenza Integration | Targeting $80 million in annual run-rate net expense synergies by end of 2025. | Consolidate risk management, regulatory reporting, and trading tools into a single Fintech suite. |
| Cloud Migration (AWS) | Achieved up to 10% performance improvement (latency) on core markets; SaaS ARR target >40%. | Migrate core exchange matching engines to a hybrid cloud model for scalability and resiliency. |
| AI for Market Surveillance | AI pilot achieved 80% accuracy in identifying pump-and-dump schemes. | Roll out AI-enhanced surveillance platform to all 50+ exchange and regulator clients starting in Q4 2025. |
| DLT/Tokenization | Proposing rule changes (19b-4 filing) to allow trading of 'tokenized form' securities. | Establish a foundation for next-generation, 24/7 trading and settlement infrastructure. |
| Cybersecurity Threat | Global cybercrime cost projected at $10.5 trillion in 2025; average breach cost at $4.88 million. | Continuous investment in AI-powered threat detection and automated incident response to protect critical trading systems. |
Nasdaq, Inc. (NDAQ) - PESTLE Analysis: Legal factors
Compliance costs rising due to new SEC rules on short selling and market structure
The regulatory environment is defintely tightening, meaning Nasdaq, Inc. faces rising internal compliance costs and must also support its clients through major regulatory shifts. The Securities and Exchange Commission (SEC) is pushing for greater transparency in market data and trading practices, which directly impacts Nasdaq's core technology services. For example, the new Market Data Infrastructure Rule is fully live in 2025, requiring exchanges to share pricing data faster and cheaper, which means significant capital expenditure for Nasdaq to upgrade its infrastructure to meet the new speed and accessibility mandates.
In addition, the Regulation SHO updates, effective June 2025, require short sellers to report positions daily instead of monthly under the Consolidated Audit Trail (CAT) system. While this rule primarily targets traders, it forces Nasdaq, as a key market operator, to enhance its surveillance and data collection capabilities. The cost of compliance for a large financial entity's clients-like a hedge fund-is estimated at around $1 million a year per Deloitte, which illustrates the scale of regulatory pressure being passed through the ecosystem. This environment increases Nasdaq's regulatory risk and the operational complexity of its market services business.
Ongoing legal risks related to data privacy and cross-border data transfer regulations
Nasdaq's global footprint and technology offerings expose it to significant and escalating legal risks concerning data privacy and cross-border data transfer, especially in 2025. The U.S. Department of Justice (DOJ) Final Rule on Preventing Access to U.S. Sensitive Personal Data by Countries of Concern, which took effect on April 8, 2025, is a game-changer. This rule restricts or prohibits data flows to entities connected with countries like China, Russia, and Iran, elevating data exposure from a privacy issue to a national security concern.
Full enforcement of this DOJ Rule began on July 8, 2025, and by October 6, 2025, companies engaged in restricted transactions must implement robust due diligence, recordkeeping, and independent annual audits. Violations are serious: civil fines can reach the greater of $368,136 (adjusted annually) or twice the value of a covered transaction, per violation. This means Nasdaq must invest heavily in data mapping and compliance technology to ensure that its vast data streams-including market data, client information, and internal operations data-do not inadvertently breach these new national security-focused regulations.
Enforcement of listing standards, particularly around minimum public float requirements
Nasdaq is actively strengthening its listing standards in 2025 to protect investors and enhance market quality, which has a direct legal and business impact on its listed companies and its own reputation. In September 2025, Nasdaq filed several proposed rules with the SEC, with a decision expected by December 18, 2025.
The core change is the push for higher liquidity requirements, specifically the Market Value of Unrestricted Publicly Held Shares (MVUPHS), or public float. Honestly, this is a necessary move to clear out low-quality listings.
Here's the quick math on the proposed changes:
| Listing Standard | Current MVUPHS Minimum | Proposed MVUPHS Minimum (2025) |
|---|---|---|
| Capital Market (Net Income Standard) | $5 million | $15 million |
| Global Market (Net Income Standard) | $8 million | $15 million |
| New Listings from China (Minimum IPO Proceeds) | N/A | $25 million |
What this estimate hides is the accelerated delisting risk. Nasdaq also proposed an accelerated process to suspend and delist companies that have a listing deficiency and a Market Value of Listed Securities below $5 million. As of September 10, 2025, around 300 Nasdaq-listed companies failed to meet quantitative continued listing requirements, indicating a large pool of companies facing this heightened delisting risk. This move reduces Nasdaq's legal exposure to low-quality issuers but risks alienating smaller companies.
Litigation risk from competitors over intellectual property in trading technology
Intellectual property (IP) litigation is a constant and material risk for Nasdaq, given its position as a leading provider of trading technology globally, not just an exchange operator. The company has a direct, ongoing legal battle with a competitor, IEX Group, Inc. (IEX), having filed a patent infringement lawsuit in the U.S. District Court for the District of New Jersey.
The lawsuit asserts that IEX knowingly violated seven Nasdaq patents related to its electronic trading technology. These patents cover critical innovations like:
- Closing auction processes.
- Multi-parallel order processing.
- Matching engine performance.
- Data feed optimizations.
Protecting this IP is crucial because Nasdaq's Technology Services segment generates significant revenue by licensing its systems to over 130 exchanges and market operators worldwide. Still, the risk cuts both ways. The Patent Trial and Appeal Board (PTAB) has already invalidated all 38 claims of a separate Nasdaq patent (U.S. Patent No. 7747506) in a challenge brought by competitor Miami International Holdings (MIAX), demonstrating that Nasdaq's IP is under constant legal attack. The legal costs for defending and prosecuting these complex, multi-patent cases are substantial and ongoing through the 2025 fiscal year.
Nasdaq, Inc. (NDAQ) - PESTLE Analysis: Environmental factors
Nasdaq, Inc.'s Own Commitment to Achieving Carbon Neutrality Goals
As a major financial technology company, Nasdaq, Inc. has set ambitious internal environmental targets, anchoring its strategy around a commitment to reach Net Zero emissions by 2030. This is a decisive move, especially since the Real Estate and Facilities (REF) and Data Center (DC) portfolios are the main contributors to the company's direct carbon footprint.
The company's progress is measurable: total reported Greenhouse Gas (GHG) emissions decreased from 107,844 metric tons in 2023 to 97,488 metric tons in 2024. Crucially, they have already driven their Scope 2 emissions (from purchased energy) to zero by procuring 100% renewable electricity for all global operations. This is a huge win.
The biggest challenge now is the supply chain, which accounts for nearly 55% of the total 2024 GHG emissions. To address this, Nasdaq, Inc. has Science Based Targets initiative (SBTi) approved goals, which include:
- Reduce absolute Scope 1 and 2 GHG emissions 90% by 2032.
- Reduce absolute Scope 3 GHG emissions 50% by 2032.
- Ensure 70% of suppliers by spend set science-based targets by 2027.
Honestly, getting your suppliers on board is the hardest part of any net-zero plan.
Increased Demand for Transparency on Carbon Footprint from Listed Companies
The regulatory and investor pressure for environmental transparency is not just a trend; it's a hard requirement now. New U.S. Securities and Exchange Commission (SEC) rules mandate comprehensive disclosure of climate-related risks and emissions for publicly traded companies, including data center operators. You need to report on both the qualitative and quantitative impacts of climate risk on your strategy and financials.
This regulatory shift creates a massive opportunity for Nasdaq, Inc. to sell its own sustainability solutions. They use their own platforms, like Nasdaq Metrio™ and Nasdaq Sustainable Lens®, internally to centralize ESG data, which helped them get named the #1 most sustainable company in the United States by TIME and Statista in June 2025. They are selling the tools that solved their own problem.
The market is demanding standardized, comparable data, so Nasdaq, Inc. is meeting that need with data products.
| Data Solution | Key Environmental Focus | Coverage/Impact |
|---|---|---|
| Sustainability Data Hub (via Nasdaq Data Link) | Comprehensive ESG data sets | Wide range of global institutional investors |
| Nordic ESG Metrics Data Feed | Standardized ESG performance metrics | Covers 800+ Nasdaq Nordic listed firms |
| Nasdaq Sustainable Bond Network | Green, social, and sustainability bond data | Connects issuers and investors for sustainable debt |
Opportunities in Creating New ESG-Focused Indices and Derivatives Products
The shift to sustainable investing is directly fueling Nasdaq, Inc.'s product development pipeline. Investors are moving billions into strategies that screen for environmental factors, so the demand for new indices and derivatives to manage that exposure is huge.
Nasdaq, Inc. is actively expanding its suite of ESG-focused financial products. This includes a complete family of Green Equity Indexes and a range of ESG index derivatives and Custom Basket Forwards that enable clients to balance sustainable investment policies with broad market access.
For instance, the Nasdaq-100 ESG Index (NDXESG) is a modified market capitalization-weighted index that uses a company's ESG Risk Rating Score as an adjustment factor. The ESG characteristics of the underlying issuers are re-evaluated each quarter-in March, June, September, and December-to ensure the index remains current with the latest sustainability data.
This is where the money is: creating the plumbing for the new sustainable economy.
Physical Climate Risk Affecting Data Center Operations is a Long-Term Concern
While transition risks (like policy changes and carbon pricing) are currently assessed as more significant, the physical climate risk to Nasdaq, Inc.'s data centers is a critical long-term concern. The nature of their business-high-speed, mission-critical trading-means any operational disruption from a climate event is a severe financial risk.
A 2025 report on global data centers confirms the rising threat from climate hazards like flooding, tropical cyclones, and extreme heat, which can compromise critical digital infrastructure. Nasdaq, Inc. is addressing this by expanding its climate scenario analyses to evaluate the exposure of its entire global portfolio of offices and data centers to both chronic and acute climate hazards.
The company's reliance on its data center and real estate portfolios for its carbon footprint means that managing physical risk-protecting those assets from climate change-is inseparable from meeting its net-zero goals. They must invest in resilience to safeguard long-term value.
Disclaimer
All information, articles, and product details provided on this website are for general informational and educational purposes only. We do not claim any ownership over, nor do we intend to infringe upon, any trademarks, copyrights, logos, brand names, or other intellectual property mentioned or depicted on this site. Such intellectual property remains the property of its respective owners, and any references here are made solely for identification or informational purposes, without implying any affiliation, endorsement, or partnership.
We make no representations or warranties, express or implied, regarding the accuracy, completeness, or suitability of any content or products presented. Nothing on this website should be construed as legal, tax, investment, financial, medical, or other professional advice. In addition, no part of this site—including articles or product references—constitutes a solicitation, recommendation, endorsement, advertisement, or offer to buy or sell any securities, franchises, or other financial instruments, particularly in jurisdictions where such activity would be unlawful.
All content is of a general nature and may not address the specific circumstances of any individual or entity. It is not a substitute for professional advice or services. Any actions you take based on the information provided here are strictly at your own risk. You accept full responsibility for any decisions or outcomes arising from your use of this website and agree to release us from any liability in connection with your use of, or reliance upon, the content or products found herein.