
|
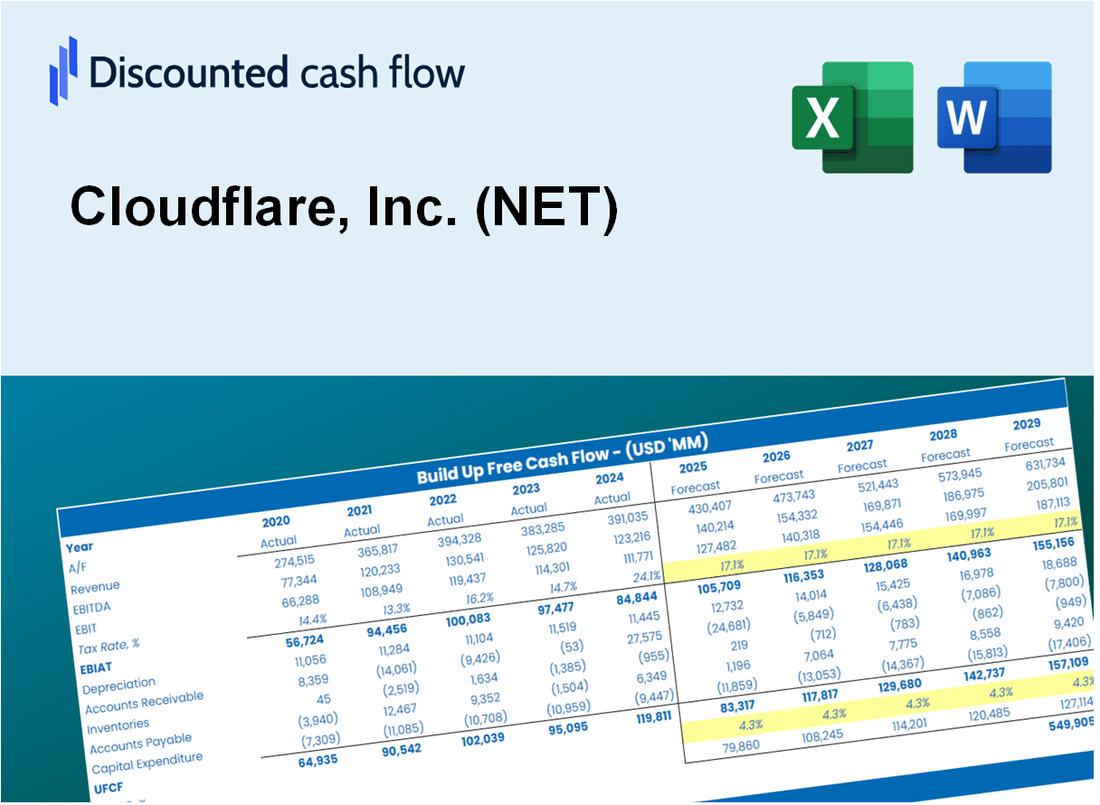
Cloudflare, Inc. (NET) DCF Valuation |
Fully Editable: Tailor To Your Needs In Excel Or Sheets
Professional Design: Trusted, Industry-Standard Templates
Investor-Approved Valuation Models
MAC/PC Compatible, Fully Unlocked
No Expertise Is Needed; Easy To Follow
Cloudflare, Inc. (NET) Bundle
Enhance your investment strategy with the Cloudflare, Inc. (NET) DCF Calculator! Review up-to-date financials, adjust growth projections and expenses, and observe how these modifications affect Cloudflare, Inc. (NET) intrinsic value in real-time.
What You Will Get
- Editable Forecast Inputs: Effortlessly modify assumptions (growth %, margins, WACC) to generate various scenarios.
- Real-World Data: Cloudflare’s financial data pre-loaded to accelerate your analysis.
- Automatic DCF Outputs: The template computes Net Present Value (NPV) and intrinsic value for you.
- Customizable and Professional: A refined Excel model that adjusts to your valuation requirements.
- Built for Analysts and Investors: Perfect for evaluating projections, confirming strategies, and optimizing time.
Key Features
- Comprehensive Performance Metrics: Gain access to reliable pre-loaded historical data and future growth forecasts for Cloudflare, Inc. (NET).
- Adjustable Growth Assumptions: Modify highlighted fields such as customer acquisition costs, revenue growth rates, and operating margins.
- Real-Time Calculations: Instantaneous updates for DCF, Net Present Value (NPV), and cash flow evaluations.
- Interactive Dashboard: User-friendly charts and summaries to easily interpret your valuation outcomes.
- Designed for All Users: An intuitive layout tailored for investors, financial analysts, and business consultants.
How It Works
- Step 1: Download the Excel file.
- Step 2: Review Cloudflare’s pre-filled financial data and forecasts.
- Step 3: Modify key inputs such as revenue growth, WACC, and tax rates (highlighted cells).
- Step 4: Observe the DCF model update in real-time as you adjust assumptions.
- Step 5: Evaluate the outputs and leverage the results for investment decisions regarding Cloudflare, Inc. (NET).
Why Choose This Calculator?
- User-Friendly Interface: Perfectly suited for both novices and seasoned professionals.
- Customizable Inputs: Adjust parameters easily to tailor your financial analysis.
- Real-Time Feedback: Observe immediate updates to Cloudflare’s valuation as you modify inputs.
- Preloaded Data: Comes equipped with Cloudflare’s actual financial metrics for swift evaluations.
- Relied Upon by Experts: Favored by investors and analysts for making well-informed choices.
Who Should Use This Product?
- Investors: Accurately assess Cloudflare’s fair value before making investment choices.
- CFOs: Utilize a professional-grade DCF model for financial reporting and analysis related to Cloudflare (NET).
- Consultants: Easily customize the template for valuation reports tailored to Cloudflare (NET) clients.
- Entrepreneurs: Acquire insights into financial modeling practices employed by leading tech firms like Cloudflare (NET).
- Educators: Implement it as a teaching resource to illustrate valuation methodologies relevant to Cloudflare (NET).
What the Template Contains
- Preloaded NET Data: Historical and projected financial data, including revenue, EBIT, and capital expenditures.
- DCF and WACC Models: Professional-grade sheets for calculating intrinsic value and Weighted Average Cost of Capital.
- Editable Inputs: Yellow-highlighted cells for adjusting revenue growth, tax rates, and discount rates.
- Financial Statements: Comprehensive annual and quarterly financials for deeper analysis.
- Key Ratios: Profitability, leverage, and efficiency ratios to evaluate performance.
- Dashboard and Charts: Visual summaries of valuation outcomes and assumptions.
Disclaimer
All information, articles, and product details provided on this website are for general informational and educational purposes only. We do not claim any ownership over, nor do we intend to infringe upon, any trademarks, copyrights, logos, brand names, or other intellectual property mentioned or depicted on this site. Such intellectual property remains the property of its respective owners, and any references here are made solely for identification or informational purposes, without implying any affiliation, endorsement, or partnership.
We make no representations or warranties, express or implied, regarding the accuracy, completeness, or suitability of any content or products presented. Nothing on this website should be construed as legal, tax, investment, financial, medical, or other professional advice. In addition, no part of this site—including articles or product references—constitutes a solicitation, recommendation, endorsement, advertisement, or offer to buy or sell any securities, franchises, or other financial instruments, particularly in jurisdictions where such activity would be unlawful.
All content is of a general nature and may not address the specific circumstances of any individual or entity. It is not a substitute for professional advice or services. Any actions you take based on the information provided here are strictly at your own risk. You accept full responsibility for any decisions or outcomes arising from your use of this website and agree to release us from any liability in connection with your use of, or reliance upon, the content or products found herein.