
|
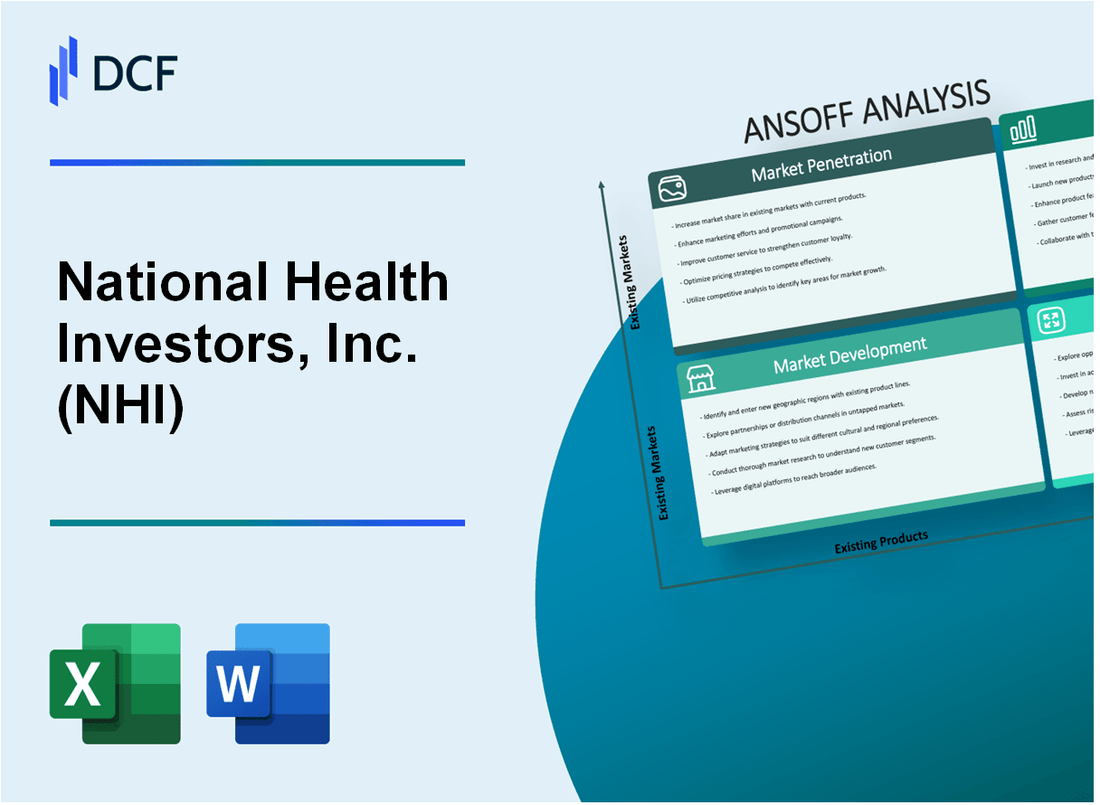
National Health Investors, Inc. (NHI): ANSOFF MATRIX [Dec-2025 Updated] |
Fully Editable: Tailor To Your Needs In Excel Or Sheets
Professional Design: Trusted, Industry-Standard Templates
Investor-Approved Valuation Models
MAC/PC Compatible, Fully Unlocked
No Expertise Is Needed; Easy To Follow
National Health Investors, Inc. (NHI) Bundle
You're looking at how National Health Investors, Inc. (NHI) can accelerate growth beyond its strong 2025 performance, especially with Normalized FFO projected up to $4.91 per share. Honestly, after two decades in this game, I see a clear playbook here for you to analyze. We've distilled the strategy into four lanes: aggressively penetrating the current market by pushing existing SHOP assets toward that 13% to 16% NOI growth target, expanding into new US states and Canada, developing novel financing products like preferred equity structures, and even exploring non-healthcare diversification like life science labs. This isn't just academic; it's a concrete set of actions for the next phase. Dive into the matrix below to see the specific plays for each quadrant.
National Health Investors, Inc. (NHI) - Ansoff Matrix: Market Penetration
You're looking at how National Health Investors, Inc. (NHI) plans to deepen its hold in its existing markets, which is the essence of market penetration strategy. This involves maximizing revenue from current assets and tenant relationships, primarily through the SHOP platform.
A key action here is the strategic shift from traditional leasing to operational involvement.
- Convert more triple-net leases into the higher-growth Senior Housing Operating Portfolio (SHOP) structure.
National Health Investors, Inc. (NHI) has been actively executing this conversion. Effective August 1, 2025, six properties formerly under a triple-net lease with Discovery were transitioned into the existing SHOP venture with Discovery. Furthermore, effective May 1, 2025, the Discovery triple net master lease on six properties was amended to cooperate in the transition to a new SHOP venture. By the third quarter of 2025, National Health Investors, Inc. (NHI) transitioned a total of seven properties to its SHOP segment. As of the August 2025 guidance update, the expected SHOP conversion NOI for the full year 2025 was in a range of $3.6 million - $3.7 million.
The focus on operational excellence within the existing portfolio is quantified by the growth targets for the SHOP segment.
- Target the high end of the 13% to 16% same-store SHOP Net Operating Income (NOI) growth guidance.
The high end of the previously stated same-store SHOP NOI growth guidance for 2025 is 16% year over year. For context, the updated 2025 guidance range, as of the third quarter, was revised to 7% to 9% over 2024. The Q2 2025 SHOP NOI was approximately $3.8 million, representing a 29.4% year-over-year increase, with a SHOP NOI margin of 26.9%.
Capital deployment within existing asset types supports this penetration strategy by funding improvements or accretive investments in core areas.
| Capital Deployment Metric | Amount/Rate |
| Unidentified 2025 Capital Deployment | $105 million |
| Average Initial Yield on Deployment | 8.1% |
| Q2 2025 Completed New Acquisitions | $63.5 million |
The guidance for 2025 includes deploying the remaining $105 million in unidentified new investments at an initial average yield of 8.1%. In the third quarter, National Health Investors, Inc. (NHI) had completed $303.2 million in investments for 2025. As of October 2, 2025, National Health Investors, Inc. (NHI) had completed investments of approximately $249.2 million year-to-date in 2025 at an average initial yield of 8.0%.
Lease optimization directly impacts cash flow and operational stability, which is critical for the SHOP model's success.
- Increase occupancy and rent escalators in existing Skilled Nursing Facilities (SNFs) through operator incentives.
While specific SNF incentive details are not explicitly detailed, the focus on operator performance is evident through deferred rent collections across the portfolio. The outstanding balance of deferred rents was approximately $18.5 million at March 31, 2025. The company expected continued collection of deferred rents as part of its 2025 assumptions.
- Optimize lease terms with current tenants to ensure timely collection of deferred rents.
Timely collection is a stated assumption for 2025 guidance. For the three months ended June 30, 2025, net income included approximately $1.9 million in the repayment of previously deferred rent and related interest. In Q1 2025, National Health Investors, Inc. (NHI) collected approximately $2.0 million in deferral repayments. However, the August 2025 guidance noted an expected $0.8 million in lower Discovery cash rent for the year, net of deferred rent recoveries.
Here's a look at key operational metrics related to existing assets:
- Q2 2025 average occupancy for the SHOP portfolio was 89.1%, up 210 bps year-over-year.
- Q2 2025 Revenue per Occupied Room (RevPOR) was $3,071, up 3.7% year-over-year.
Finance: draft 13-week cash view by Friday.
National Health Investors, Inc. (NHI) - Ansoff Matrix: Market Development
National Health Investors, Inc. (NHI) is actively pursuing Market Development by expanding its US footprint into new states, as evidenced by recent acquisitions in the third quarter of 2025. On October 1, 2025, the Company invested $74.3 million for the acquisition of four properties located in Oklahoma and Oregon, adding 344 residential units to its portfolio. This activity shows a clear move into new geographic areas with favorable trends.
The pace of investment activity in 2025 demonstrates this development focus. As of November 6, 2025, National Health Investors, Inc. had announced total investment activity of $303.2 million year-to-date, surpassing the investment total from the prior year. This accelerated investment pace, which included an earlier investment of $174.9 million in the first quarter of 2025, supports the strategy of entering new markets.
To diversify tenant concentration, National Health Investors, Inc. has established new operator partnerships. The Company added three new operating partners in the first quarter of 2025: Generations, Juniper Communities, and Agemark. These new relationships are already translating into investments in new regions. For example, an investment of $63.5 million was made in April 2025 for a portfolio of six memory care communities in Nebraska operated by Agemark Senior Living. Furthermore, a $46.3 million investment was made in March 2025 for a community in Bergen County, New Jersey, partnering with Juniper Communities.
The strategy of leveraging the strong balance sheet to enter new US metropolitan areas is supported by key financial metrics. As of the latest reports, Net Debt to Adjusted EBITDA stood at 3.9x, which is below the company's target range of 4x-5x. Liquidity was reported at approximately $760 million, including cash and revolver capacity, providing ample access to capital for funding growth in new markets. While the outline mentions pursuing strategic investments in Canadian senior housing markets, the publicly available 2025 data focuses on US expansion, with the headquarters remaining in Murfreesboro, Tennessee.
Regarding the offering of existing Medical Office Building (MOB) financing, National Health Investors, Inc. specializes in sale-leaseback, joint venture, mortgage, and mezzanine financing of medical facility investments. The company's focus on growth is underpinned by its financial health, which is a prerequisite for expanding financing options.
Here is a summary of recent investments supporting Market Development and operator diversification:
| Date Announced | Investment Amount (Millions USD) | State/Region | Partner | Property Type Focus |
| October 1, 2025 | $74.3 | Oklahoma and Oregon | Compass Senior Living | SHOP Segment Properties |
| April 2025 | $63.5 | Nebraska | Agemark Senior Living | Memory Care Communities |
| March 2025 | $46.3 | New Jersey (Bergen County) | Juniper Communities | Assisted Living/Memory Care |
The strategic moves into new states and with new operators are part of a broader growth plan. The company continues to transition properties from triple-net leases to the Senior Housing Operating Portfolio (SHOP) segment, which saw consolidated SHOP NOI year-over-year growth of approximately 63% in the third quarter of 2025.
The key elements of this Market Development approach include:
- Expanding US footprint into states like Oklahoma and Oregon with $74.3 million invested in Q3 2025.
- Establishing new operator partnerships, including Generations, Juniper Communities, and Agemark.
- Investing $303.2 million year-to-date in 2025, exceeding prior year activity.
- Maintaining a strong balance sheet with Net Debt to Adjusted EBITDA at 3.9x to support new capital deployment.
- Focusing on senior housing and medical facility investments, which is the core of National Health Investors, Inc.'s financing expertise.
National Health Investors, Inc. (NHI) - Ansoff Matrix: Product Development
You're looking at how National Health Investors, Inc. (NHI) can create new offerings for its existing operator base or new segments within healthcare real estate. This is about developing new financial tools and property types to drive growth beyond simple acquisitions.
For instance, developing a new financing product, like a preferred equity structure, would appeal to operators needing capital but perhaps not wanting to sell the asset outright. National Health Investors, Inc. (NHI) shows a capacity for large capital raises, evidenced by the $350 million aggregate principal amount of 5.350% Senior Notes priced in September 2025. This balance sheet strength, with a net debt to adjusted EBITDA ratio of 3.6x as of Q3 2025 and liquidity near $1.1 billion, provides the foundation to structure more complex, bespoke capital solutions for high-quality partners.
Another product development path involves shifting investment focus to next-generation, high-tech Medical Office Buildings (MOBs) centered on outpatient surgery and diagnostics. While National Health Investors, Inc. (NHI) is heavily focused on Senior Housing Operating Portfolio (SHOP) growth, with consolidated SHOP NOI up approximately 63% year-over-year in Q3 2025, the company's investment activity year-to-date exceeded $303.2 million. This deployment capacity could be channeled into MOBs, perhaps mirroring the recent $74.3 million SHOP acquisition but directed toward outpatient facilities, which often command higher lease rates and better revenue visibility than traditional senior housing.
Consider the creation of a dedicated fund for niche behavioral health or addiction treatment facilities. This is a market segment requiring specialized underwriting. The existing portfolio structure, which includes specialty hospitals, suggests an internal competency to evaluate these assets. The company's commitment to shareholder returns, affirmed by a quarterly dividend of $0.92 per share, means any new fund structure must be accretive and scalable.
To boost Revenue Per Occupied Room (RevPOR) in existing senior housing, National Health Investors, Inc. (NHI) could offer capital specifically earmarked for property renovations. The company is already managing existing assets where RevPOR was $3,008 in Q1 2025, up 0.7% year-over-year. Offering renovation capital could be tied to performance hurdles, aiming to push Same Store SHOP NOI growth toward the upper end of its 7% - 9% guidance range for 2025.
Finally, structuring joint ventures to acquire entrance-fee communities represents a defintely unique asset class play. This strategy allows National Health Investors, Inc. (NHI) to participate in the higher upfront capital component of these communities while sharing development or operational risk. The company's existing real estate properties, net, stood at $2,316,452 thousand as of June 30, 2025. This scale supports complex partnership structures.
Here's a quick look at the financial context supporting these product development ideas:
| Metric | Value (Latest Reported) | Context/Date |
|---|---|---|
| Total YTD Investment Activity | $303.2 million | As of Q3 2025 |
| Latest SHOP Acquisition Size | $74.3 million | Closed October 2025 |
| Projected 2025 Normalized FFO/Share Midpoint | $4.90 | Updated for FY 2025 |
| Q1 2025 RevPOR | $3,008 | Senior Housing Operating Portfolio |
| September 2025 Notes Coupon Rate | 5.350% | $350 million Senior Notes |
These product development strategies rely on National Health Investors, Inc. (NHI)'s ability to deploy capital effectively and manage risk across varied asset types. The focus on operational improvement is clear:
- Develop a new financing product, like a preferred equity structure, to attract high-quality operators.
- Invest in next-generation, high-tech MOBs focused on outpatient surgery centers and diagnostics.
- Create a dedicated fund for niche behavioral health or addiction treatment facilities.
- Offer capital for property renovations to boost RevPOR in existing senior housing.
- Structure joint ventures to acquire entrance-fee communities, a defintely unique asset class.
What this estimate hides is the specific internal cost to develop and market these new financial products versus the expected yield premium they would generate over standard lease structures. Finance: draft a sensitivity analysis on preferred equity hurdle rates by next Tuesday.
National Health Investors, Inc. (NHI) - Ansoff Matrix: Diversification
You're looking at how National Health Investors, Inc. (NHI) might move beyond its established senior housing and medical facility base. Honestly, the core business is still showing growth; for instance, the Senior Housing Operating Portfolio (SHOP) NOI saw a year-over-year growth of approximately 63% in the third quarter of 2025. Still, a REIT with a real estate portfolio valued at over $2.316 billion as of June 30, 2025, needs to map out adjacent or entirely new territory.
The company's investment pace in 2025 shows a capacity for significant capital deployment. Year-to-date investments through Q3 2025 exceeded $303.2 million. Even looking at the first quarter, announced investments totaled $174.9 million at an average initial yield of 8.2%. This deployment capability is what underpins any move into new asset classes.
Here's a snapshot of the scale you are working with:
| Metric | Value (as of June 30, 2025, in thousands unless noted) | Source Period |
| Real estate properties, net | $2,316,452 | Q2 2025 |
| Debt, net | $1,118,835 | Q2 2025 |
| Net Debt to Adjusted EBITDA Ratio | Low end of 4.0x - 5.0x target range | Q1 2025 |
| YTD Investments | Over $303.2 million | Q3 2025 |
| Q1 2025 Investment Yield (Average) | 8.2% | Q1 2025 |
| Projected FY 2025 Normalized FFO per Share (Midpoint) | $4.80 (Q2 update) or $4.90 (Q3 update) | Q2/Q3 2025 |
| Quarterly Dividend Declared | $0.92 per share | Q3 2025 |
The diversification strategies, which fall squarely into the Ansoff Matrix's Diversification quadrant (new market, new product), would look like this in terms of potential action:
- - Acquire real estate in non-healthcare sectors like specialized industrial or cold storage logistics.
- - Invest in life science real estate labs near major university research hubs outside the core portfolio.
- - Form a joint venture to develop affordable senior housing, targeting a new payor segment.
- - Enter select European healthcare real estate markets with a local operating partner.
- - Launch a new debt product, a higher-yield mezzanine loan program for non-REIT healthcare developers.
For example, moving into non-healthcare real estate, such as industrial logistics, would require National Health Investors, Inc. to build expertise in a completely different leasing structure and tenant base. The current portfolio is heavily weighted toward senior housing and medical facilities, with recent Q1 2025 acquisitions including a 120-unit assisted living/memory care community for $46.3 million and a Nebraska memory care portfolio for $63.5 million. These are all within the core competency.
Entering European markets, for instance, would mean navigating different regulatory environments and currency risks, something the company has touched upon with prior UK activity, but a full-scale European REIT strategy is a different beast. The debt product idea-a mezzanine loan program-would shift National Health Investors, Inc. from primarily a landlord to a lender in certain situations, which changes the risk profile significantly from its typical triple-net lease model. The existing mortgage and other notes receivable portfolio stood at $252,939 thousand as of June 30, 2025, providing some baseline for lending activity.
To fund this, National Health Investors, Inc. has access to capital markets, having settled approximately $65.5 million from a forward equity sale agreement in Q1 2025. Furthermore, the company had $409.0 million available under its at-the-market (ATM) program as of April 2025. Finance: draft the capital allocation impact analysis for a hypothetical $200 million non-healthcare acquisition by end of Q1 2026.
Disclaimer
All information, articles, and product details provided on this website are for general informational and educational purposes only. We do not claim any ownership over, nor do we intend to infringe upon, any trademarks, copyrights, logos, brand names, or other intellectual property mentioned or depicted on this site. Such intellectual property remains the property of its respective owners, and any references here are made solely for identification or informational purposes, without implying any affiliation, endorsement, or partnership.
We make no representations or warranties, express or implied, regarding the accuracy, completeness, or suitability of any content or products presented. Nothing on this website should be construed as legal, tax, investment, financial, medical, or other professional advice. In addition, no part of this site—including articles or product references—constitutes a solicitation, recommendation, endorsement, advertisement, or offer to buy or sell any securities, franchises, or other financial instruments, particularly in jurisdictions where such activity would be unlawful.
All content is of a general nature and may not address the specific circumstances of any individual or entity. It is not a substitute for professional advice or services. Any actions you take based on the information provided here are strictly at your own risk. You accept full responsibility for any decisions or outcomes arising from your use of this website and agree to release us from any liability in connection with your use of, or reliance upon, the content or products found herein.