
|
NMI Holdings, Inc. (NMIH): 5 FORCES Analysis [Nov-2025 Updated] |
Fully Editable: Tailor To Your Needs In Excel Or Sheets
Professional Design: Trusted, Industry-Standard Templates
Investor-Approved Valuation Models
MAC/PC Compatible, Fully Unlocked
No Expertise Is Needed; Easy To Follow
NMI Holdings, Inc. (NMIH) Bundle
You're digging into the competitive moat around NMI Holdings, Inc. as we close out 2025, and frankly, the picture is complex. While the industry's high capital demands-like the GSEs' Private Mortgage Insurer Eligibility Requirements-create a solid wall against new entrants, the established players are locked in a tough fight. Honestly, for NMI Holdings, Inc., the real pressure comes from customers who see this product as a commodity, making price the ultimate weapon, even as the company manages a massive $\mathbf{\$218.4}$ billion in-force book. Keep reading; we'll map out exactly where the leverage sits across all five forces so you can see the near-term risks and opportunities clearly.
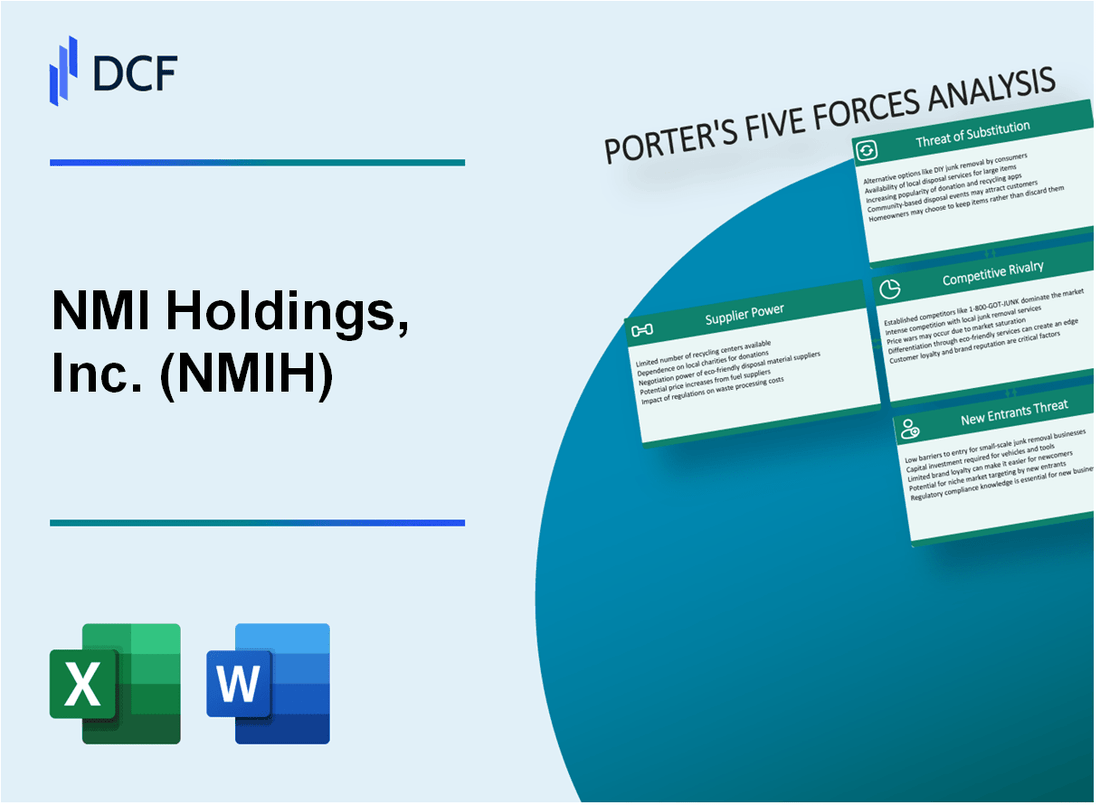
NMI Holdings, Inc. (NMIH) - Porter's Five Forces: Bargaining power of suppliers
You're looking at the suppliers for NMI Holdings, Inc. (NMIH), and honestly, the power dynamic here is split. Some inputs are firmly controlled by external bodies, while others offer you plenty of choice.
GSEs (Fannie Mae/Freddie Mac) dictate non-negotiable PMIERs capital standards.
The Government-Sponsored Enterprises (GSEs), under the Federal Housing Finance Agency (FHFA) oversight, set the Private Mortgage Insurer Eligibility Requirements (PMIERs). These aren't suggestions; they are the price of entry to insure loans they acquire. The revised PMIERs framework began its phased implementation starting March 31, 2025. This means NMI Holdings, Inc. must structure its capital to meet these rules, giving the GSEs significant, non-negotiable power over its capital structure. For the second quarter ended June 30, 2025, NMI Holdings, Inc.'s capital position relative to these requirements was quite strong:
| Metric | Amount as of June 30, 2025 (Q2 2025) |
|---|---|
| PMIERs Total Available Assets | $3.2 billion |
| Net Risk-Based Required Assets | $1.9 billion |
You can see the cushion is there, but the required asset calculation itself is dictated by the GSEs. If they change the rules-and they did with the revised framework-NMI Holdings, Inc. has to adapt its asset mix. That's supplier power, even if the supplier is a regulator.
Reinsurance market is diversified, limiting power over NMI Holdings, Inc. risk transfer.
When it comes to transferring risk, NMI Holdings, Inc. deals with the reinsurance market, which seems to be working in its favor lately. The company secured new reinsurance treaties covering its 2025 and 2026 production. Furthermore, for the third quarter of 2025, the reinsurance market conditions were described as robust, allowing NMI Holdings, Inc. to achieve the best pricing year-to-date for its risk transfer needs. This suggests a competitive environment among reinsurers, which keeps their individual bargaining power in check. NMI Holdings, Inc. utilizes a broad panel of reinsurers, which inherently diversifies its counterparty risk and limits any single supplier's leverage.
- Risk transfer is supported by new treaties for 2025 and 2026 production.
- Q3 2025 pricing for risk transfer was reported as the best year-to-date.
- The program uses a broad panel of highly rated reinsurers.
Technology and data suppliers have low leverage due to multiple vendor options.
For the core technology systems that run the business, NMI Holdings, Inc. faces risks related to provider performance, but the sheer number of available vendors generally keeps any single supplier's leverage low. The company has a Chief of Operations and Technology, showing internal focus on this area. While specific spending figures aren't public, the structure of the mortgage insurance industry suggests that core processing and data services are often sourced from multiple providers, preventing dependency lock-in. If onboarding takes 14+ days, churn risk rises, but here, the risk is more about system failure than supplier price hikes.
Regulatory compliance costs are high, acting as a fixed, non-negotiable input cost.
Beyond the GSEs' capital rules, NMI Holdings, Inc. must adhere to comprehensive state and federal regulations. These compliance mandates create a baseline cost that is essentially fixed and non-negotiable. While specific, standalone regulatory compliance expense figures aren't broken out in the latest reports, the necessity of maintaining compliance with covenants under its 2024 Revolving Credit Facility, which includes the PMIERs standard, confirms this ongoing, mandatory expenditure. For instance, commitment fees related to that facility were $0.1 million for the three months ended September 30, 2025. These are the costs of doing business that suppliers of regulatory interpretation and compliance services can charge for, but the need for the service is driven by external, non-negotiable mandates.
NMI Holdings, Inc. (NMIH) - Porter's Five Forces: Bargaining power of customers
You're looking at the customer side of NMI Holdings, Inc.'s business, and honestly, the leverage lenders have is significant. This power stems directly from the structure of the private mortgage insurance (MI) market itself. For a lender, the decision of who insures a loan often comes down to a few key players, and that concentration of choice gives them negotiating muscle.
Mortgage lenders can easily switch between the six major private MI providers. These key competitors-Arch, Enact, Essent, MGIC, NMI Holdings, Inc., and Radian-operate in a space where product differentiation is tough. As an executive from NMI Holdings, Inc. noted, the private mortgage insurance market has become what you might call a homogeneous market. When products look the same, price becomes defintely the critical selection factor. You see this pressure because, as one executive stated, the only way to move market share is often to cut prices. That's a clear signal of buyer power.
NMI Holdings, Inc. serves a large number of lenders, which helps dilute the power of any single one, but the sheer number of available options keeps the pressure on. As of December 31, 2024, NMI Holdings, Inc. had issued master policies with 2,086 customers. That's a broad base, but it's the competition that matters most to the individual lender shopping for the best rate.
Here's a quick look at the competitive landscape and NMI Holdings, Inc.'s customer scale based on the latest available figures:
| Metric | Value | Date/Context |
|---|---|---|
| Number of Major Private MI Providers | 6 | 2Q 2025 Industry Snapshot |
| NMI Holdings, Inc. Customers (Master Policies) | 2,086 | As of December 31, 2024 |
| NMI Holdings, Inc. Q3 2025 Total Revenue | $178.7 million | Quarter Ending September 30, 2025 |
Customers definitely have strong leverage. Switching costs in this industry are generally low; lenders are not locked into long-term, high-cost contracts for the insurance itself, especially when it comes to new business. This low friction, combined with the industry price competition you see across the six main players, means lenders can shop around for the best premium rates. If NMI Holdings, Inc.'s pricing isn't competitive, a lender can move their next tranche of low down-payment loans elsewhere without major operational pain. This dynamic forces NMI Holdings, Inc. to focus on what they call competitive pricing using risk-based technology.
The key factors driving customer bargaining power include:
- Low switching costs for new loan originations.
- The perception of MI as a homogeneous product.
- Direct price competition among the six main underwriters.
- The ability to negotiate terms based on volume.
NMI Holdings, Inc. (NMIH) - Porter's Five Forces: Competitive rivalry
The private mortgage insurance sector where NMI Holdings, Inc. operates is characterized by a high degree of rivalry. You see this structure clearly when you look at the key players.
Industry is a tight oligopoly of six main insurers, including NMI Holdings, Inc.
The competitive set is small, which often leads to strategic moves that are highly visible to rivals. Milliman's first quarter 2025 update tracks performance across these six key providers:
- Arch
- Enact
- Essent
- MGIC
- NMI Holdings, Inc.
- Radian
The Federal Housing Finance Agency Office of Inspector General confirmed in March 2025 that there continue to be only six active mortgage insurers approved to provide coverage for Enterprise mortgages. This concentration means any significant pricing action by one player is immediately felt by the others.
Competition is intense, often driving down premium rates for new insurance written.
Executives within the industry have noted that the market has become 'a homogeneous market.' To gain new business volume, the pressure to lower prices is significant. Here's the quick math on what that means for market share pursuit:
| Metric | Value/Context | Source Year/Period |
| NMI Holdings, Inc. Primary Insurance-in-Force | $218.4 billion | Q3 2025 |
| Industry New Insurance Written (NIW) Estimate (All Six) | Roughly $285 billion (Expected) | 2024 (Expected similar for 2025) |
| Individual Insurer Share (Enterprise Coverage) | Between 14 and 18 percent each | Year-end 2024 |
| Total Enterprise Coverage Volume | Approximately $377 billion | Year-end 2024 |
The direct consequence of this structure is that executives feel compelled to cut prices to move from one market share percentage to the next. If one insurer attempts to grow new insurance written (NIW) by moving from, say, a 16% share to 18%, the market reaction is to 'just push prices down.'
NMI Holdings, Inc. has a strong in-force book of $218.4 billion as of Q3 2025.
This large, established book provides a crucial base against the competitive pricing pressures on new business. The in-force book represents a stream of earned premiums that is less immediately subject to today's spot rates. For NMI Holdings, Inc., the primary insurance-in-force reached a record $218.4 billion at the end of the third quarter of 2025. This portfolio generated record net premiums earned of $151.3 million in Q3 2025. The company's ability to maintain a high persistency rate, reported at 83.9% in Q3 2025, helps stabilize this revenue base.
High fixed costs and low marginal costs incentivize aggressive market share pursuit.
While specific cost breakdowns aren't public, the operating leverage in the business is evident from the expense structure. Once the platform and personnel are in place-the fixed costs-the cost to insure one additional loan (marginal cost) is relatively low. This dynamic naturally pushes companies to write more business to spread those fixed costs over a larger premium base. NMI Holdings, Inc. demonstrated strong cost management in Q3 2025, achieving a record low expense ratio of 19.3%. This efficiency is key; lower operating costs mean a lower breakeven point, allowing the company to aggressively price new business to gain share while still remaining profitable, something smaller or less efficient competitors might struggle to match.
Consider the Q3 2025 results that show this operating leverage in action:
- GAAP Net Income: $96 million
- Total Revenue: $178.7 million
- Return on Equity (ROE): 15.6%
- Expense Ratio: 19.3% (Record Low)
You need to watch the NIW production figures against these profitability metrics; that's where you see the trade-off between growth and rate discipline.
NMI Holdings, Inc. (NMIH) - Porter's Five Forces: Threat of substitutes
You're looking at the competitive landscape for NMI Holdings, Inc. (NMIH), and the threat of substitutes is definitely a big one, especially when government programs offer a way around private mortgage insurance (MI) altogether. These government-backed options aren't going anywhere; they're baked into the housing system.
Government-backed FHA and VA loans are major, non-cancelable alternatives. For instance, VA loans, which require no mortgage insurance, saw their share of mortgaged homebuyers rise to 7.3% nationwide in August 2025, up from 6.5% the prior year. At the halfway point of fiscal year 2025, VA purchase lending was up nearly 10% compared to the same period in FY 2024, showing strong momentum for this substitute product. FHA loans, popular with first-time buyers, typically require only a 3.5% down payment. These government options represent a structural alternative to the conventional loan market where NMI Holdings, Inc. (NMIH) primarily operates.
Lender-Paid Mortgage Insurance (LPMI) directly replaces borrower-paid MI. This is a substitution within the MI product itself, where the lender effectively pays the premium by charging a slightly higher interest rate, which can feel less immediate to the borrower. The overall Lenders Mortgage Insurance market size is projected to grow from $9.23 billion in 2024 to $9.85 billion in 2025, showing this segment is still expanding despite substitution pressures. However, one form of this, the Lender Paid Single Premium MI, is non-refundable, and the Homeowners Protection Act of 1998 doesn't apply to it, meaning borrowers lose the built-in exit strategy present in borrower-paid MI.
Borrowers can cancel private MI when LTV reaches 80%, a built-in exit. This statutory right under the Homeowners Protection Act (HPA) provides a clear path out of the expense for borrowers with Borrower-Paid MI. Lenders must automatically cancel when the balance hits 78% of the original value, but borrowers can request removal once they hit 80% equity. The Private Mortgage Insurance market, which includes these borrower-paid products, is expected to grow from $6.24 billion in 2024 to $6.84 billion in 2025, a CAGR of 9.5%. Still, this built-in exit is a key difference compared to the government alternatives or non-refundable LPMI options.
High interest rates push more borrowers toward lower-cost government options. As of late November 2025, the average 30-year fixed mortgage rate was hovering around 6.23% to 6.40%. While this is down from recent peaks, it's still significantly higher than the historical average of 7.71% between April 1971 and November 2025. When rates are elevated, the lower upfront costs or no MI requirement of FHA/VA loans become much more attractive to budget-conscious buyers, increasing the pull toward these substitutes. It's a tough environment for conventional loans.
Here's a quick look at how the MI segments are trending:
| Market Segment | 2024 Size (USD) | 2025 Projected Size (USD) | CAGR (2024-2025) |
| Lenders Mortgage Insurance (LPMI included) | $9.23 billion | $9.85 billion | 6.7% |
| Private Mortgage Insurance (PMI) | $6.24 billion | $6.84 billion | 9.5% |
The appeal of government options is further cemented by their inherent cost structure:
- VA loans: Zero mortgage insurance premium.
- FHA loans: Mortgage Insurance Premium (MIP) is often required for the life of the loan.
- Conventional PMI: Cancellable at 80% LTV upon request.
- LPMI: Non-refundable single premium option exists.
If onboarding takes 14+ days, churn risk rises, but here the risk is borrowers choosing a different loan type entirely.
NMI Holdings, Inc. (NMIH) - Porter's Five Forces: Threat of new entrants
The threat of new entrants into the private mortgage insurance (MI) sector, which is critical for NMI Holdings, Inc. to manage, is significantly constrained by regulatory hurdles and the immense capital base required to compete effectively.
Private Mortgage Insurer Eligibility Requirements (PMIERs) demand substantial capital.
To even qualify to insure loans acquired by Fannie Mae and Freddie Mac (the GSEs), a new entrant must meet the stringent Private Mortgage Insurer Eligibility Requirements (PMIERs). These requirements mandate holding significant, highly liquid assets to cover potential claims under stress scenarios. As of June 30, 2024, the existing private mortgage insurers collectively held more than \$26.8 billion in PMIERs available assets. For context on the capital required for an incumbent like NMI Holdings, Inc., as of June 30, 2024, the company reported PMIERs total available assets of \$2,828 million against risk-based required assets of \$1,652 million, resulting in an excess funding capacity of \$1,176 million under the existing framework. The barrier isn't just meeting the minimum; it's matching the sheer volume of capital already deployed.
New entrants must secure critical approval from the GSEs (Fannie Mae/Freddie Mac).
Eligibility is not automatic; it is granted by the GSEs under the oversight of the Federal Housing Finance Agency (FHFA). The PMIERs themselves are the core financial and operational standards for this approval. The FHFA announced updates to the PMIERs in August 2024, with a phased implementation beginning March 31, 2025, and fully effective by September 30, 2026. Any new entrant must navigate this evolving, complex regulatory standard, which dictates everything from asset quality to operational controls. Furthermore, the GSEs have a transparent, objective process for approving new products and activities, which a new MI would need to successfully pass to ensure its insured loans can be purchased by the Enterprises.
Achieving scale and building relationships with lenders is a high barrier.
The incumbent market players have established deep, long-standing relationships across the mortgage origination ecosystem. NMI Holdings, Inc. itself serves a diverse customer base including national and regional mortgage banks, money center banks, and credit unions. The scale of business is massive; in 2024, the entire private MI industry supported nearly \$300 billion in mortgage originations. To be a viable competitor, a new firm must quickly build the infrastructure and trust to secure a significant share of this volume, which is a relationship-driven business. For NMI Holdings, Inc. alone, its primary insurance-in-force stood at \$211.3 billion at the end of the first quarter of 2025. A new entrant faces the challenge of displacing entrenched providers who already have established workflows with thousands of lenders.
Incumbents collectively hold \$11 billion in excess PMIERs capital, deterring entry.
The collective financial strength of the existing MI companies acts as a powerful deterrent. While the exact figure for excess capital as of late 2025 is not published, the aggregate capital buffer is substantial. As of June 30, 2024, the industry held over \$26.8 billion in PMIERs available assets. This level of capital, which exceeds the minimum required assets, signals to potential new entrants that the established players are heavily capitalized to withstand economic stress and absorb losses, making the investment required to compete on a similar footing extremely high. The market size itself is projected to grow from \$6.24 billion in 2024 to \$6.84 billion in 2025, suggesting that the existing players are positioned to capture the majority of this growth without needing to cede significant market share to a startup.
Here's a quick look at the capital positioning:
| Metric | Value (as of mid-2024 or latest available) | Source Context |
|---|---|---|
| Collective Industry PMIERs Available Assets | \$26.8 billion | June 30, 2024 |
| NMI Holdings, Inc. Excess Funding Capacity (Pro Forma Revised PMIERs) | \$1,144 million | Estimated as of June 30, 2024 |
| NMI Holdings, Inc. Primary Insurance-in-Force | \$211.3 billion | End of Q1 2025 |
| Industry Mortgage Originations Supported | Nearly \$300 billion | 2024 |
The regulatory and capital requirements mean that starting a private mortgage insurance company today is not a matter of securing a few bank lines; it requires billions in committed, liquid capital and a multi-year plan to satisfy the GSEs.
- PMIERs compliance requires holding the most liquid investments.
- GSE approval is mandatory for insuring Enterprise-acquired loans.
- The industry supported \$300 billion in 2024 originations.
- NMI Holdings' Q3 2025 net income was \$96 million.
- The market size is projected to reach \$6.84 billion in 2025.
Disclaimer
All information, articles, and product details provided on this website are for general informational and educational purposes only. We do not claim any ownership over, nor do we intend to infringe upon, any trademarks, copyrights, logos, brand names, or other intellectual property mentioned or depicted on this site. Such intellectual property remains the property of its respective owners, and any references here are made solely for identification or informational purposes, without implying any affiliation, endorsement, or partnership.
We make no representations or warranties, express or implied, regarding the accuracy, completeness, or suitability of any content or products presented. Nothing on this website should be construed as legal, tax, investment, financial, medical, or other professional advice. In addition, no part of this site—including articles or product references—constitutes a solicitation, recommendation, endorsement, advertisement, or offer to buy or sell any securities, franchises, or other financial instruments, particularly in jurisdictions where such activity would be unlawful.
All content is of a general nature and may not address the specific circumstances of any individual or entity. It is not a substitute for professional advice or services. Any actions you take based on the information provided here are strictly at your own risk. You accept full responsibility for any decisions or outcomes arising from your use of this website and agree to release us from any liability in connection with your use of, or reliance upon, the content or products found herein.