
|
O-I Glass, Inc. (OI) DCF Valuation |
Fully Editable: Tailor To Your Needs In Excel Or Sheets
Professional Design: Trusted, Industry-Standard Templates
Investor-Approved Valuation Models
MAC/PC Compatible, Fully Unlocked
No Expertise Is Needed; Easy To Follow
O-I Glass, Inc. (OI) Bundle
Enhance your investment strategies with the O-I Glass, Inc. (OI) DCF Calculator! Review authentic financial data for O-I Glass, adjust growth projections and expenses, and observe how these modifications affect the intrinsic value of O-I Glass, Inc. (OI) in real-time.
What You Will Receive
- Authentic O-I Glass Financial Data: Pre-loaded with historical and forecasted data for accurate analysis.
- Completely Customizable Template: Easily adjust key metrics such as revenue growth, WACC, and EBITDA %.
- Instant Calculations: Watch O-I Glass’s intrinsic value update in real-time as you make adjustments.
- Expert Valuation Tool: Tailored for investors, analysts, and consultants aiming for precise DCF outcomes.
- Intuitive Design: Straightforward layout and clear guidance suitable for all skill levels.
Key Features
- Comprehensive DCF Calculator: Offers detailed unlevered and levered DCF valuation models tailored for O-I Glass, Inc. (OI).
- WACC Calculator: Features a pre-built Weighted Average Cost of Capital sheet with customizable inputs for precise analysis.
- Customizable Forecast Assumptions: Adjust growth rates, capital expenditures, and discount rates to fit O-I Glass, Inc. (OI) projections.
- Integrated Financial Ratios: Evaluate profitability, leverage, and efficiency ratios specifically for O-I Glass, Inc. (OI).
- Visual Dashboard and Charts: Provides visual outputs that summarize key valuation metrics for straightforward analysis.
How It Works
- Download the Template: Get instant access to the Excel-based O-I Glass, Inc. (OI) DCF Calculator.
- Input Your Assumptions: Adjust yellow-highlighted cells for growth rates, WACC, margins, and other key factors.
- Instant Calculations: The model automatically updates O-I Glass, Inc.'s (OI) intrinsic value.
- Test Scenarios: Simulate various assumptions to assess potential changes in valuation.
- Analyze and Decide: Utilize the results to inform your investment or financial analysis.
Why Choose O-I Glass, Inc. (OI)?
- Innovative Solutions: Benefit from cutting-edge glass manufacturing technologies tailored for modern needs.
- Environmental Commitment: O-I Glass prioritizes sustainability, ensuring eco-friendly practices in production.
- Global Expertise: With a presence in multiple countries, O-I Glass brings a wealth of industry knowledge.
- Quality Assurance: Rigorous quality control processes guarantee top-notch products for all customers.
- Customer-Centric Approach: Focused on building strong partnerships and meeting client needs effectively.
Who Should Use O-I Glass, Inc. (OI)?
- Glass Industry Students: Understand manufacturing processes and apply them to real-world scenarios.
- Researchers: Utilize industry-specific models for studies and analysis in the glass sector.
- Investors: Evaluate your investment strategies and assess the market performance of O-I Glass, Inc. (OI).
- Market Analysts: Enhance your analysis with a customizable financial model tailored for the glass industry.
- Entrepreneurs: Discover how large manufacturers like O-I Glass, Inc. (OI) operate and strategize.
What the Template Contains
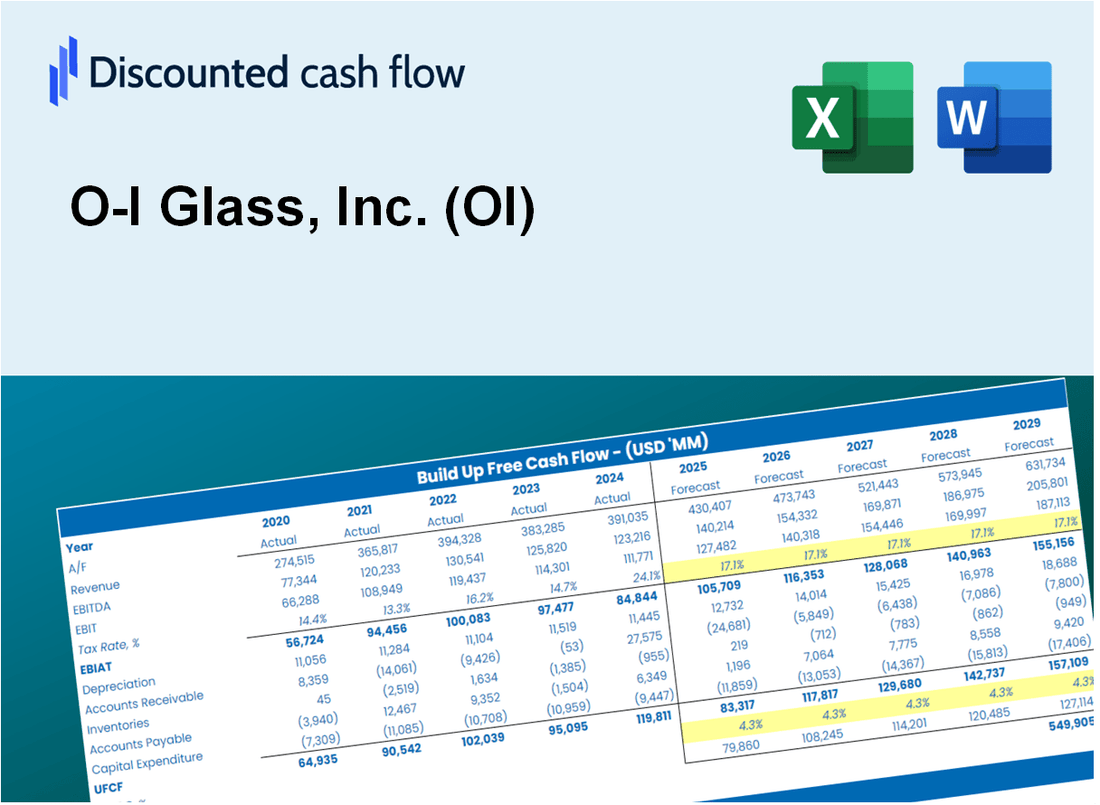
- Operating and Balance Sheet Data: Pre-filled O-I Glass, Inc. (OI) historical data and forecasts, including revenue, EBITDA, EBIT, and capital expenditures.
- WACC Calculation: A dedicated sheet for Weighted Average Cost of Capital (WACC), including parameters like Beta, risk-free rate, and share price.
- DCF Valuation (Unlevered and Levered): Editable Discounted Cash Flow models showing intrinsic value with detailed calculations.
- Financial Statements: Pre-loaded financial statements (annual and quarterly) to support analysis.
- Key Ratios: Includes profitability, leverage, and efficiency ratios for O-I Glass, Inc. (OI).
- Dashboard and Charts: Visual summary of valuation outputs and assumptions to analyze results easily.
Disclaimer
All information, articles, and product details provided on this website are for general informational and educational purposes only. We do not claim any ownership over, nor do we intend to infringe upon, any trademarks, copyrights, logos, brand names, or other intellectual property mentioned or depicted on this site. Such intellectual property remains the property of its respective owners, and any references here are made solely for identification or informational purposes, without implying any affiliation, endorsement, or partnership.
We make no representations or warranties, express or implied, regarding the accuracy, completeness, or suitability of any content or products presented. Nothing on this website should be construed as legal, tax, investment, financial, medical, or other professional advice. In addition, no part of this site—including articles or product references—constitutes a solicitation, recommendation, endorsement, advertisement, or offer to buy or sell any securities, franchises, or other financial instruments, particularly in jurisdictions where such activity would be unlawful.
All content is of a general nature and may not address the specific circumstances of any individual or entity. It is not a substitute for professional advice or services. Any actions you take based on the information provided here are strictly at your own risk. You accept full responsibility for any decisions or outcomes arising from your use of this website and agree to release us from any liability in connection with your use of, or reliance upon, the content or products found herein.