
|
Ohio Valley Banc Corp. (OVBC) DCF Valuation |
Fully Editable: Tailor To Your Needs In Excel Or Sheets
Professional Design: Trusted, Industry-Standard Templates
Investor-Approved Valuation Models
MAC/PC Compatible, Fully Unlocked
No Expertise Is Needed; Easy To Follow
Ohio Valley Banc Corp. (OVBC) Bundle
Gain insight into your Ohio Valley Banc Corp. (OVBC) valuation analysis with our cutting-edge DCF Calculator! Preloaded with real OVBC data, this Excel template enables you to adjust forecasts and assumptions for an accurate calculation of Ohio Valley Banc Corp.'s intrinsic value.
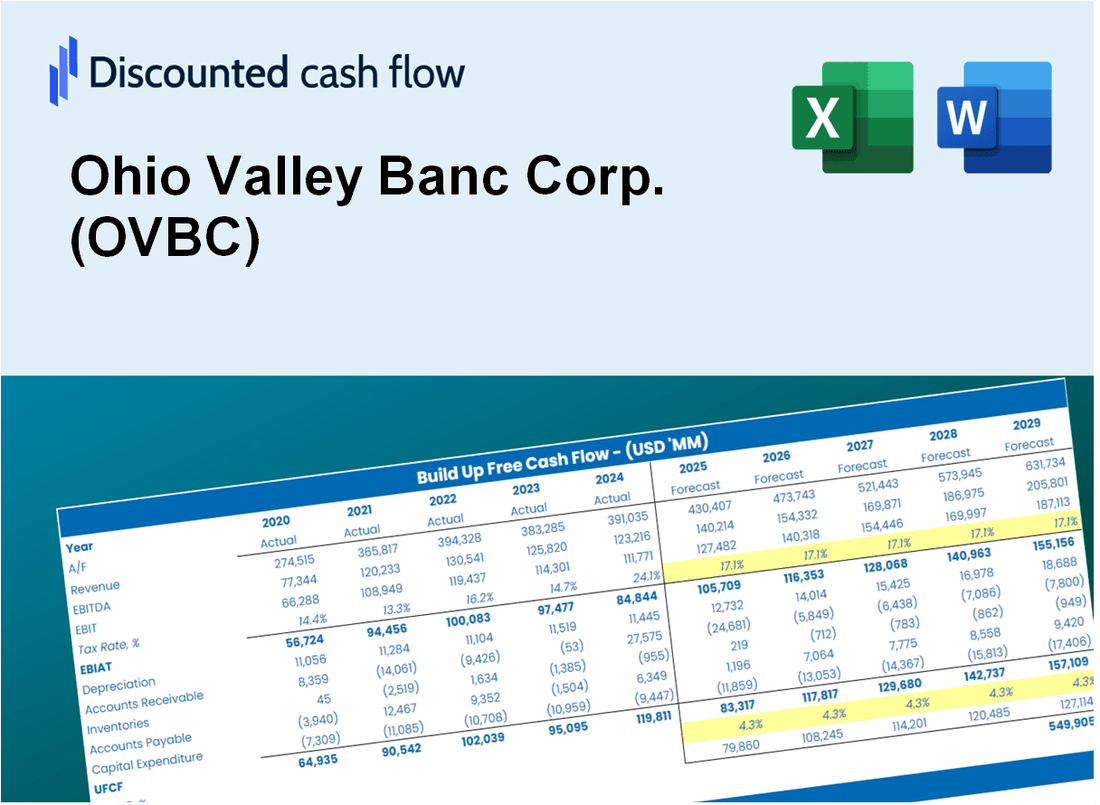
Discounted Cash Flow (DCF) - (USD MM)
| Year | AY1 2020 |
AY2 2021 |
AY3 2022 |
AY4 2023 |
AY5 2024 |
FY1 2025 |
FY2 2026 |
FY3 2027 |
FY4 2028 |
FY5 2029 |
|---|---|---|---|---|---|---|---|---|---|---|
| Revenue | 55.6 | 54.6 | 57.8 | 74.5 | 88.9 | 100.6 | 113.7 | 128.6 | 145.4 | 164.4 |
| Revenue Growth, % | 0 | -1.86 | 5.87 | 28.93 | 19.38 | 13.08 | 13.08 | 13.08 | 13.08 | 13.08 |
| EBITDA | 13.8 | 15.6 | 17.5 | 16.8 | 15.1 | 24.8 | 28.0 | 31.7 | 35.9 | 40.6 |
| EBITDA, % | 24.88 | 28.64 | 30.29 | 22.53 | 16.99 | 24.67 | 24.67 | 24.67 | 24.67 | 24.67 |
| Depreciation | 1.5 | 1.6 | 1.6 | 1.6 | 1.7 | 2.5 | 2.9 | 3.2 | 3.7 | 4.1 |
| Depreciation, % | 2.75 | 2.95 | 2.72 | 2.2 | 1.95 | 2.51 | 2.51 | 2.51 | 2.51 | 2.51 |
| EBIT | 12.3 | 14.0 | 15.9 | 15.1 | 13.4 | 22.3 | 25.2 | 28.5 | 32.2 | 36.4 |
| EBIT, % | 22.13 | 25.68 | 27.57 | 20.33 | 15.04 | 22.15 | 22.15 | 22.15 | 22.15 | 22.15 |
| Total Cash | 253.1 | 331.4 | 231.9 | 290.4 | 281.7 | 100.6 | 113.7 | 128.6 | 145.4 | 164.4 |
| Total Cash, percent | .0 | .0 | .0 | .0 | .0 | .0 | .0 | .0 | .0 | .0 |
| Account Receivables | 3.3 | 2.7 | 3.1 | 3.6 | 4.8 | 5.3 | 6.0 | 6.8 | 7.7 | 8.7 |
| Account Receivables, % | 5.97 | 4.94 | 5.39 | 4.84 | 5.4 | 5.31 | 5.31 | 5.31 | 5.31 | 5.31 |
| Inventories | .0 | .0 | .0 | .0 | .0 | .0 | .0 | .0 | .0 | .0 |
| Inventories, % | 0 | 0 | 0 | 0 | 0 | 0 | 0 | 0 | 0 | 0 |
| Accounts Payable | .0 | .0 | .0 | .0 | .0 | .0 | .0 | .0 | .0 | .0 |
| Accounts Payable, % | 0 | 0 | 0 | 0 | 0 | 0 | 0 | 0 | 0 | 0 |
| Capital Expenditure | -3.5 | -1.1 | -2.0 | -2.7 | -1.4 | -3.4 | -3.8 | -4.3 | -4.9 | -5.5 |
| Capital Expenditure, % | -6.2 | -1.99 | -3.44 | -3.61 | -1.61 | -3.37 | -3.37 | -3.37 | -3.37 | -3.37 |
| Tax Rate, % | 17.77 | 17.77 | 17.77 | 17.77 | 17.77 | 17.77 | 17.77 | 17.77 | 17.77 | 17.77 |
| EBITAT | 10.3 | 11.7 | 13.3 | 12.6 | 11.0 | 18.5 | 21.0 | 23.7 | 26.8 | 30.3 |
| Depreciation | ||||||||||
| Changes in Account Receivables | ||||||||||
| Changes in Inventories | ||||||||||
| Changes in Accounts Payable | ||||||||||
| Capital Expenditure | ||||||||||
| UFCF | 5.0 | 12.9 | 12.5 | 11.0 | 10.1 | 17.1 | 19.3 | 21.8 | 24.7 | 27.9 |
| WACC, % | 13.76 | 13.8 | 13.8 | 13.73 | 13.62 | 13.74 | 13.74 | 13.74 | 13.74 | 13.74 |
| PV UFCF | ||||||||||
| SUM PV UFCF | 74.2 | |||||||||
| Long Term Growth Rate, % | 2.00 | |||||||||
| Free cash flow (T + 1) | 28 | |||||||||
| Terminal Value | 242 | |||||||||
| Present Terminal Value | 127 | |||||||||
| Enterprise Value | 202 | |||||||||
| Net Debt | -34 | |||||||||
| Equity Value | 235 | |||||||||
| Diluted Shares Outstanding, MM | 5 | |||||||||
| Equity Value Per Share | 49.69 |
What You Will Receive
- Pre-Filled Financial Model: Ohio Valley Banc Corp.'s (OVBC) actual data facilitates accurate DCF valuation.
- Comprehensive Forecast Control: Modify revenue growth, profit margins, WACC, and other essential metrics.
- Real-Time Calculations: Automatic updates provide immediate insights as you adjust inputs.
- Professional-Grade Template: A polished Excel file crafted for high-quality valuation presentations.
- Flexible and Reusable: Designed for adaptability, enabling multiple uses for in-depth forecasting.
Key Features
- 🔍 Real-Life OVBC Financials: Pre-filled historical and projected data for Ohio Valley Banc Corp. (OVBC).
- ✏️ Fully Customizable Inputs: Adjust all critical parameters (yellow cells) like WACC, growth %, and tax rates.
- 📊 Professional DCF Valuation: Built-in formulas calculate Ohio Valley Banc Corp.’s intrinsic value using the Discounted Cash Flow method.
- ⚡ Instant Results: Visualize Ohio Valley Banc Corp.’s valuation instantly after making changes.
- Scenario Analysis: Test and compare outcomes for various financial assumptions side-by-side.
How It Works
- Download: Obtain the pre-built Excel file featuring Ohio Valley Banc Corp.'s (OVBC) financial data.
- Customize: Modify projections such as revenue growth, EBITDA %, and WACC to fit your analysis.
- Update Automatically: Watch as the intrinsic value and NPV calculations refresh in real-time.
- Test Scenarios: Generate various forecasts and instantly compare the results.
- Make Decisions: Leverage the valuation insights to inform your investment choices.
Why Choose This Calculator for Ohio Valley Banc Corp. (OVBC)?
- Accuracy: Utilizes real Ohio Valley Banc Corp. financials for precise data.
- Flexibility: Crafted for users to easily adjust and experiment with inputs.
- Time-Saving: Eliminate the need to construct a DCF model from the ground up.
- Professional-Grade: Built with the precision and usability expected at the CFO level.
- User-Friendly: Intuitive design makes it accessible for those without extensive financial modeling skills.
Who Should Use This Product?
- Individual Investors: Make informed decisions about buying or selling Ohio Valley Banc Corp. (OVBC) stock.
- Financial Analysts: Streamline valuation processes with ready-to-use financial models for Ohio Valley Banc Corp. (OVBC).
- Consultants: Deliver professional valuation insights on Ohio Valley Banc Corp. (OVBC) to clients quickly and accurately.
- Business Owners: Understand how companies like Ohio Valley Banc Corp. (OVBC) are valued to guide your own strategy.
- Finance Students: Learn valuation techniques using real-world data and scenarios related to Ohio Valley Banc Corp. (OVBC).
What the Template Contains
- Historical Data: Includes Ohio Valley Banc Corp.'s (OVBC) past financials and baseline forecasts.
- DCF and Levered DCF Models: Detailed templates to calculate Ohio Valley Banc Corp.'s (OVBC) intrinsic value.
- WACC Sheet: Pre-built calculations for Weighted Average Cost of Capital.
- Editable Inputs: Modify key drivers like growth rates, EBITDA %, and CAPEX assumptions.
- Quarterly and Annual Statements: A complete breakdown of Ohio Valley Banc Corp.'s (OVBC) financials.
- Interactive Dashboard: Visualize valuation results and projections dynamically.
Disclaimer
All information, articles, and product details provided on this website are for general informational and educational purposes only. We do not claim any ownership over, nor do we intend to infringe upon, any trademarks, copyrights, logos, brand names, or other intellectual property mentioned or depicted on this site. Such intellectual property remains the property of its respective owners, and any references here are made solely for identification or informational purposes, without implying any affiliation, endorsement, or partnership.
We make no representations or warranties, express or implied, regarding the accuracy, completeness, or suitability of any content or products presented. Nothing on this website should be construed as legal, tax, investment, financial, medical, or other professional advice. In addition, no part of this site—including articles or product references—constitutes a solicitation, recommendation, endorsement, advertisement, or offer to buy or sell any securities, franchises, or other financial instruments, particularly in jurisdictions where such activity would be unlawful.
All content is of a general nature and may not address the specific circumstances of any individual or entity. It is not a substitute for professional advice or services. Any actions you take based on the information provided here are strictly at your own risk. You accept full responsibility for any decisions or outcomes arising from your use of this website and agree to release us from any liability in connection with your use of, or reliance upon, the content or products found herein.