
|
Pfizer Inc. (PFE): 5 Forces Analysis [Jan-2025 Updated] |
Fully Editable: Tailor To Your Needs In Excel Or Sheets
Professional Design: Trusted, Industry-Standard Templates
Investor-Approved Valuation Models
MAC/PC Compatible, Fully Unlocked
No Expertise Is Needed; Easy To Follow
Pfizer Inc. (PFE) Bundle
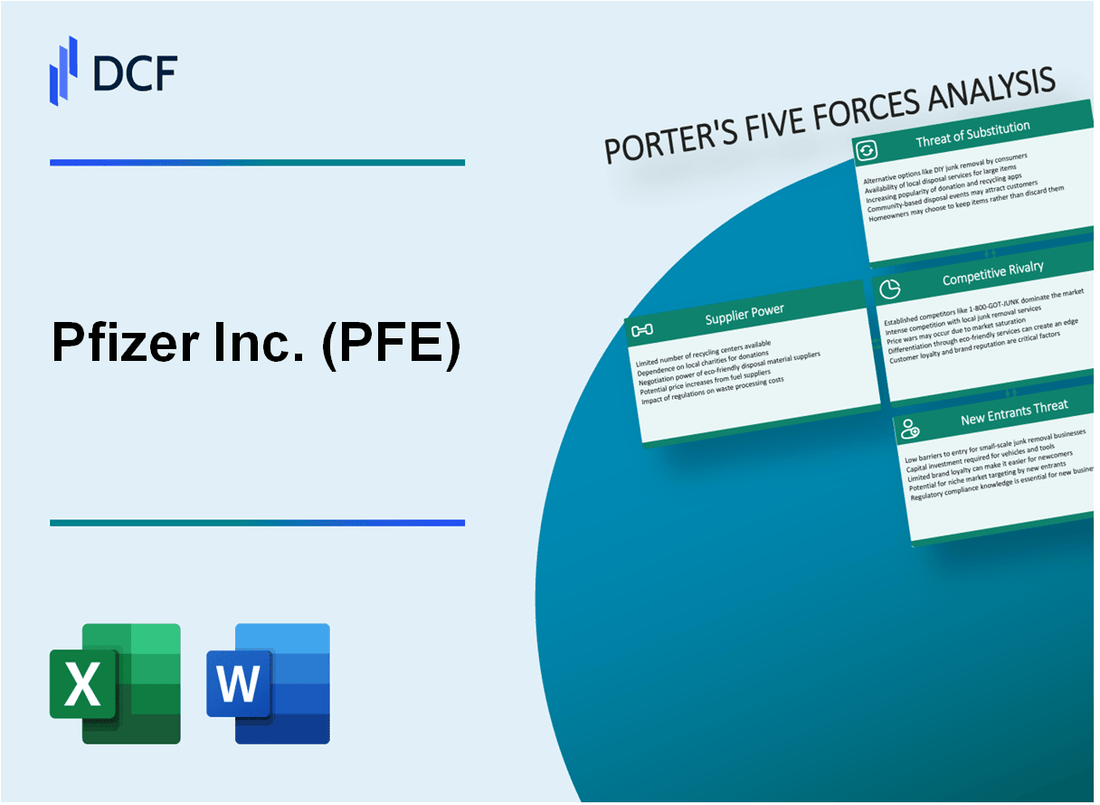
In the dynamic landscape of pharmaceutical innovation, Pfizer Inc. stands at the crossroads of complex market forces that shape its strategic positioning. As a global pharmaceutical giant, Pfizer navigates an intricate ecosystem of suppliers, customers, competitors, potential substitutes, and new market entrants. Michael Porter's Five Forces Framework reveals a nuanced analysis of the competitive dynamics that challenge and define Pfizer's business strategy in 2024, offering unprecedented insights into the company's resilience, challenges, and potential for continued growth in an increasingly competitive healthcare marketplace.
Pfizer Inc. (PFE) - Porter's Five Forces: Bargaining power of suppliers
Limited Number of Specialized Raw Material Suppliers
Pfizer relies on a restricted pool of specialized pharmaceutical ingredient suppliers. As of 2024, approximately 37 global manufacturers produce critical active pharmaceutical ingredients (APIs).
| Supplier Category | Number of Global Suppliers | Market Concentration |
|---|---|---|
| API Manufacturers | 37 | Top 5 suppliers control 65% of market |
| Specialized Chemical Suppliers | 22 | Top 3 suppliers control 48% of market |
High Switching Costs for Pharmaceutical-Grade Suppliers
Pharmaceutical-grade supplier transitions involve substantial financial implications.
- Average cost of supplier qualification: $1.2 million
- Regulatory compliance verification: $750,000
- Quality assurance testing: $450,000
- Total estimated switching costs: $2.4 million per supplier
Complex Regulatory Requirements for Pharmaceutical Supply Chains
Pharmaceutical supply chain regulations impose stringent compliance standards.
| Regulatory Body | Compliance Requirements | Annual Audit Costs |
|---|---|---|
| FDA | Good Manufacturing Practices | $375,000 |
| EMA | European Quality Standards | $425,000 |
Significant Investment for New Supplier Relationships
Developing new pharmaceutical supplier relationships requires substantial financial commitment.
- Initial supplier evaluation costs: $500,000
- Technology transfer expenses: $1.1 million
- Infrastructure adaptation: $750,000
- Total investment per new supplier relationship: $2.35 million
Pfizer Inc. (PFE) - Porter's Five Forces: Bargaining power of customers
Large Pharmaceutical Distributors and Healthcare Systems
In 2023, the top 3 pharmaceutical distributors controlled 90% of the U.S. pharmaceutical distribution market:
| Distributor | Market Share |
|---|---|
| AmerisourceBergen | 32% |
| Cardinal Health | 29% |
| McKesson Corporation | 29% |
Government and Insurance Pricing Negotiations
Medicare Part D negotiated drug prices saved $11.2 billion in 2022, representing significant buyer power.
Concentration of Major Buyers
- Top 10 healthcare systems represent 35% of total pharmaceutical purchasing
- 5 largest insurance companies cover 55% of insured population
- Veterans Health Administration purchases $4.5 billion in pharmaceuticals annually
Price Sensitivity in Generic Drug Markets
Generic drug market size in 2023: $76.3 billion, with 90% price competition.
| Generic Drug Category | Average Price Reduction |
|---|---|
| Small Molecule Generics | 85% |
| Complex Generics | 65% |
Pfizer Inc. (PFE) - Porter's Five Forces: Competitive rivalry
Market Competitive Landscape
Pfizer operates in a highly competitive pharmaceutical market with the following key competitors:
| Competitor | 2023 Revenue | Market Capitalization |
|---|---|---|
| Johnson & Johnson | $81.6 billion | $406.5 billion |
| Merck & Co. | $61.4 billion | $291.3 billion |
| Moderna | $6.7 billion | $36.8 billion |
| Pfizer | $58.5 billion | $180.2 billion |
Research and Development Competitive Pressure
Pharmaceutical R&D investment levels demonstrate intense market competition:
| Company | 2023 R&D Spending | R&D as % of Revenue |
|---|---|---|
| Pfizer | $11.2 billion | 19.1% |
| Johnson & Johnson | $14.7 billion | 18.0% |
| Merck & Co. | $13.8 billion | 22.5% |
Market Consolidation Metrics
- Global pharmaceutical market size: $1.48 trillion in 2023
- Top 10 pharmaceutical companies control 52% of market share
- Number of pharmaceutical mergers in 2023: 87 transactions
- Total merger value: $214.6 billion
Competitive Innovation Indicators
| Metric | 2023 Value |
|---|---|
| New drug approvals (FDA) | 55 novel medications |
| Patent applications | 3,412 pharmaceutical patents |
| Global clinical trials | 4,287 active trials |
Pfizer Inc. (PFE) - Porter's Five Forces: Threat of substitutes
Growing Biosimilar and Generic Drug Alternatives
As of 2024, the global biosimilars market is valued at $19.5 billion, with a projected CAGR of 15.2% through 2028. Pfizer faces significant competition from generic drug alternatives across multiple therapeutic areas.
| Therapeutic Area | Generic Market Share | Estimated Annual Impact |
|---|---|---|
| Oncology | 32.4% | $4.2 billion |
| Cardiovascular | 28.7% | $3.6 billion |
| Immunology | 22.5% | $2.8 billion |
Increasing Development of Alternative Treatment Methods
Alternative treatment methods are rapidly evolving, presenting substantial substitution threats.
- RNA therapeutics market expected to reach $3.7 billion by 2025
- Gene therapy market projected at $13.5 billion by 2024
- Cell therapy alternatives growing at 16.3% annual rate
Technological Advancements in Personalized Medicine
Personalized medicine market size reached $493.7 billion in 2023, with potential substitution impacts across multiple drug categories.
| Personalized Medicine Segment | Market Value 2024 | Growth Rate |
|---|---|---|
| Precision Oncology | $127.5 billion | 18.2% |
| Genetic Testing | $86.3 billion | 12.7% |
| Pharmacogenomics | $42.9 billion | 15.6% |
Rise of Alternative Healthcare Approaches and Preventive Treatments
Alternative healthcare market demonstrates significant growth potential for substitution threats.
- Nutraceuticals market valued at $454.6 billion in 2024
- Digital health solutions market reaching $639.4 billion
- Preventive healthcare segment growing at 14.5% annually
Pfizer Inc. (PFE) - Porter's Five Forces: Threat of new entrants
High Regulatory Barriers for Pharmaceutical Market Entry
The FDA approved 37 novel drugs in 2023, demonstrating stringent market entry requirements. Total regulatory compliance costs for new pharmaceutical companies can reach $161 million before drug approval.
| Regulatory Metric | Value |
|---|---|
| FDA New Drug Approvals (2023) | 37 |
| Average Regulatory Compliance Costs | $161 million |
Substantial Capital Requirements for Drug Development
Pharmaceutical drug development requires extensive financial investment. Average research and development expenditure for a single drug ranges between $1.3 billion to $2.6 billion.
- R&D investment for new drug development: $1.3 billion - $2.6 billion
- Pfizer's 2023 R&D expenditure: $10.8 billion
- Average time from research to market: 10-15 years
Complex Clinical Trial and Approval Processes
Clinical trials involve multiple phases with extensive documentation and rigorous testing protocols. Success rates for clinical trials remain low, with approximately 12% of drugs advancing from Phase I to FDA approval.
| Clinical Trial Phase | Success Probability |
|---|---|
| Phase I to Approval | 12% |
| Average Clinical Trial Duration | 6-7 years |
Intellectual Property and Patent Protection Challenges
Patent protection provides critical market exclusivity. Standard pharmaceutical patent duration is 20 years, with potential extensions up to 5 additional years.
- Standard pharmaceutical patent duration: 20 years
- Potential patent extension: Up to 5 years
- Global patent filing costs: $100,000 - $500,000
Advanced Research and Development Infrastructure
Sophisticated research facilities and technological capabilities are essential for market penetration. Pharmaceutical companies require advanced laboratories, specialized equipment, and skilled research personnel.
| Infrastructure Component | Estimated Cost |
|---|---|
| Research Laboratory Setup | $50 million - $250 million |
| Advanced Research Equipment | $5 million - $20 million |
Disclaimer
All information, articles, and product details provided on this website are for general informational and educational purposes only. We do not claim any ownership over, nor do we intend to infringe upon, any trademarks, copyrights, logos, brand names, or other intellectual property mentioned or depicted on this site. Such intellectual property remains the property of its respective owners, and any references here are made solely for identification or informational purposes, without implying any affiliation, endorsement, or partnership.
We make no representations or warranties, express or implied, regarding the accuracy, completeness, or suitability of any content or products presented. Nothing on this website should be construed as legal, tax, investment, financial, medical, or other professional advice. In addition, no part of this site—including articles or product references—constitutes a solicitation, recommendation, endorsement, advertisement, or offer to buy or sell any securities, franchises, or other financial instruments, particularly in jurisdictions where such activity would be unlawful.
All content is of a general nature and may not address the specific circumstances of any individual or entity. It is not a substitute for professional advice or services. Any actions you take based on the information provided here are strictly at your own risk. You accept full responsibility for any decisions or outcomes arising from your use of this website and agree to release us from any liability in connection with your use of, or reliance upon, the content or products found herein.