
|
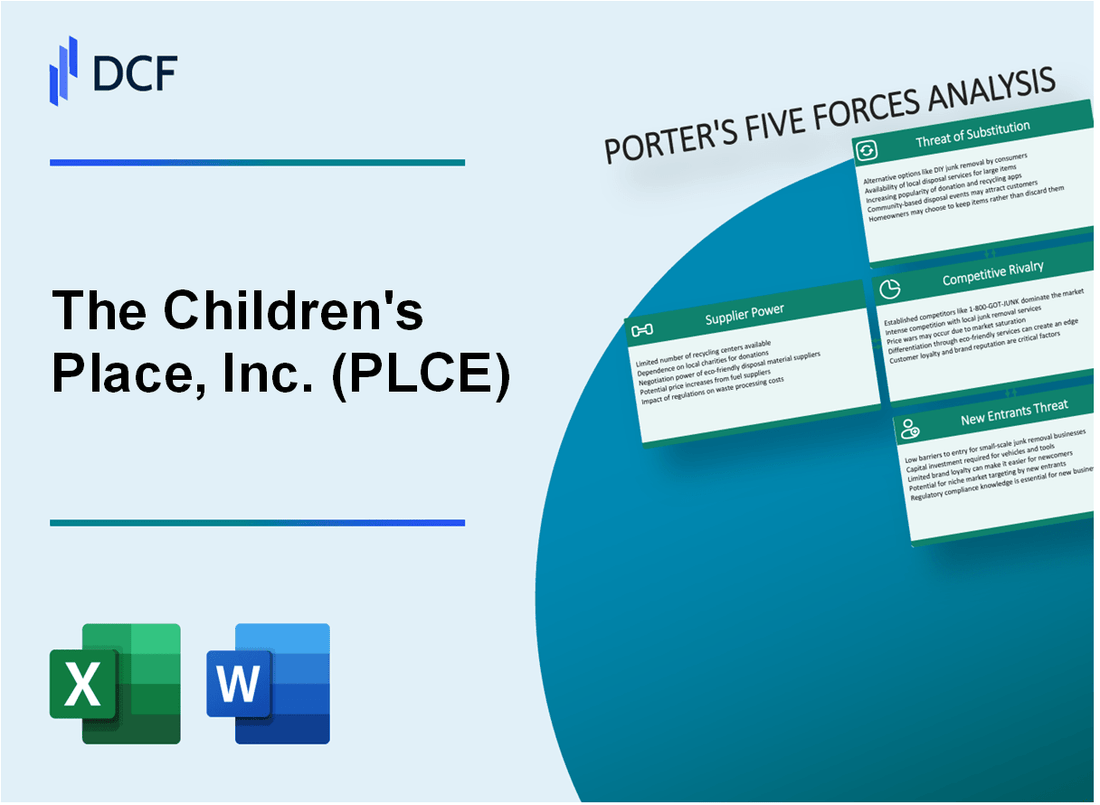
The Children's Place, Inc. (PLCE): 5 FORCES Analysis [Nov-2025 Updated] |
Fully Editable: Tailor To Your Needs In Excel Or Sheets
Professional Design: Trusted, Industry-Standard Templates
Investor-Approved Valuation Models
MAC/PC Compatible, Fully Unlocked
No Expertise Is Needed; Easy To Follow
The Children's Place, Inc. (PLCE) Bundle
You're tracking The Children's Place, Inc. (PLCE) and wondering if this turnaround sticks, right? Honestly, looking at the late 2025 landscape, the pressure is intense: Q2 saw a 6.8% net sales decrease and a $(5.4) million loss, signaling customers are definitely voting with their wallets against rivals like Target and Walmart. Before you commit capital or strategy, you need a clear view of the battlefield, so I've broken down exactly how supplier leverage, customer power, and the threat of substitutes are shaping their game plan right now. Let's cut through the noise and see where the real competitive friction lies below.
The Children's Place, Inc. (PLCE) - Porter's Five Forces: Bargaining power of suppliers
You're analyzing The Children's Place, Inc.'s supplier dynamics, and the picture is one of balancing broad geographic reach against the rising cost of compliance and materials. Supplier power is fundamentally checked by the company's scale and its deliberate sourcing strategy, but specific material commitments introduce new constraints.
The Children's Place, Inc. actively manages supplier leverage through geographic dispersion. As of the first quarter of fiscal 2025, management confirmed that their sourcing diversification strategy ensured no single country represented more than 20% of their total sourcing capacity. This broad base helps mitigate the risk of disruption or unilateral price hikes from any one manufacturing hub. Furthermore, exposure to China was reported to be in the mid-single digit range as of Q1 2025, reflecting a continued shift away from that region. This diversification is a direct countermeasure to supplier power.
However, concentration risk remains a factor in key manufacturing regions. While the exact current split is not public, the company has historically relied on specific hubs in Asia. For instance, the outline of strategic focus points to a scenario where production from countries like Bangladesh and Vietnam, potentially exceeding 15% combined, creates pockets of higher reliance that warrant close monitoring.
A significant factor currently shaping supplier negotiations is the commitment to environmental, social, and governance (ESG) standards, which inherently narrows the field of eligible partners. The Children's Place, Inc. has a public goal to source 100% of its cotton as 'more sustainable cotton' by the end of fiscal 2025. This 'more sustainable cotton' includes Better Cotton, recycled cotton, and organic cotton. By 2022, the company had already achieved 72% of its responsibly sourced cotton goal. Restricting the pool to vendors compliant with these standards-which include managing water use and chemical application-can increase the bargaining power of the remaining, qualified suppliers.
The financial reality underscores why cost control in sourcing is paramount. Sourcing costs directly impact the Cost of Goods Sold (COGS), which appears elevated relative to peers. For the full fiscal year 2025 (FY2025), The Children's Place, Inc. reported a Gross Profit Margin of 33.15%. This is a notable deficit of 8.75 percentage points when compared to the Apparel Retail Industry Average margin of 41.9% for 2025. This margin gap highlights that the cost of merchandise acquisition and preparation for sale is a critical pressure point, making cost-saving negotiations with suppliers a key operational focus.
Here is a quick look at the financial context driving supplier negotiation focus for FY2025:
| Profitability Metric | The Children's Place, Inc. (FY2025) | Apparel Retail Industry Average (2025) |
| Gross Profit Margin | 33.15% | 41.9% |
| Net Profit Margin | -4.17% | 2.6% |
The supplier power is further influenced by the company's ongoing sustainability requirements, which are not just about cotton. The company also works with vendors on reducing environmental impacts, focusing on areas like chemicals and wastewater discharge, as outlined in their Vendor Environmental Policy. These requirements demand investment from suppliers, which can be leveraged in cost discussions, but also limit flexibility in choosing the lowest-cost provider.
Key supplier-related factors influencing leverage:
- Sourcing diversification: No single country over 20% capacity as of Q1 2025.
- China exposure: In the mid-single digit range as of Q1 2025.
- Sustainable Cotton Goal: Target of 100% by end of fiscal 2025.
- FY2025 Gross Margin: 33.15%, indicating high COGS pressure.
Finance: review Q3 2025 supplier payment terms against Q2 2025 inventory levels by next Tuesday.
The Children's Place, Inc. (PLCE) - Porter's Five Forces: Bargaining power of customers
You're looking at the customer power dynamic for The Children's Place, Inc. (PLCE) as of late 2025, and frankly, the data suggests buyers hold significant leverage right now. When a retailer sees its top line shrink despite efforts to stabilize pricing and product, it's a clear sign that customers have alternatives and are exercising their choice to spend elsewhere. This pressure is evident in the recent top-line performance.
Customer power is high due to intense competition and a Q2 2025 net sales decrease of 6.8%. That drop, bringing net sales to $298.0 million for the quarter ended August 2, 2025, shows that even with efforts to streamline, the market is dictating terms. When sales volume declines, it means consumers are walking away, which is the ultimate expression of buyer power in retail.
The company has definitely tried to push back against the most price-sensitive buyers, but this move itself highlights the sensitivity. Specifically, The Children's Place, Inc. raised e-commerce shipping minimums from $20 to $40 in Q1 2025. Management was focusing on profitable top-line sales, but this action directly impacted the digital channel, contributing to the 9.6% net sales decrease seen in that first quarter.
To counter this inherent power, The Children's Place, Inc. relaunched its My Place Rewards program in October 2025. The goal here is clear: create stickiness. The data they presented suggests the existing program structure was effective at driving frequency; members historically make twice as many trips compared to non-members. The new tiered structure-Insider, Stylist, and Icon-is an attempt to deepen that engagement and make switching costs higher for the best customers.
Still, the underlying weakness in customer commitment remains visible in the core sales metrics. Comparable retail sales declined 4.7% in Q2 2025. This metric signals that even loyal shoppers, or those shopping in stores open over a year, are spending less per visit or visiting less often, which is a strong indicator that customers are easily switching to rivals offering better perceived value or experience.
Here's a quick look at the key metrics that frame this customer power dynamic:
| Metric | Period | Value |
| Net Sales Change (YoY) | Q2 2025 | -6.8% |
| Comparable Retail Sales Change | Q2 2025 | -4.7% |
| E-commerce Shipping Threshold | Effective Q1 2025 | $40 (Up from $20) |
| Loyalty Member Trip Frequency (vs. Non-Member) | Q2 2025 Data | 2x |
| Net Sales Change (YoY) | Q1 2025 | -9.6% |
The company is trying to use loyalty and better merchandising-like the Hello Kitty collaboration-to shift the balance. But for now, the customer holds the cards, evidenced by the sales contraction and the necessity of such aggressive loyalty program overhauls.
Finance: draft 13-week cash view by Friday.
The Children's Place, Inc. (PLCE) - Porter's Five Forces: Competitive rivalry
You're looking at the competitive rivalry force for The Children's Place, Inc. (PLCE), and honestly, it's a pressure cooker in this segment. The rivalry is defintely intense, not just from the specialty rivals like Carter's, but from the mass-market giants-think Target and Walmart-who can absorb margin pressure far better than a pure-play retailer can. This environment forces The Children's Place into a tough spot.
The financial results from the turnaround effort show just how much pressure this rivalry exerts. For the second quarter of fiscal 2025, The Children's Place posted a net loss of $\mathbf{(\$5.4) million}$. When you are losing money, you are almost always forced into aggressive promotional activity just to move inventory and maintain relevance against competitors who might be using price as a primary weapon. This is the direct financial consequence of high rivalry when you are in a turnaround phase.
While The Children's Place holds the title as the largest pure-play children's specialty retailer in North America, that title doesn't mean much when you look at the sheer number of players. The market is incredibly fragmented, facing over $\mathbf{649}$ active competitors. That number alone tells you that customer acquisition and retention are expensive battles.
The company's response to this competitive intensity and other operational challenges has been significant physical footprint rationalization, which suggests high exit barriers were overcome through strategic consolidation. Look at the store count change:
| Metric | Value |
| Store Count End of FY2020 | 924 |
| Store Count End of FY2024 | 495 |
| Store Count Decline (FY2020 to FY2024) | 46.4% |
This $\mathbf{46.4\%}$ reduction from $\mathbf{924}$ stores in FY2020 to $\mathbf{495}$ stores by the end of FY2024 is a clear indication of a strategic pivot away from physical locations where competition was too fierce or rents were too high. Still, this massive exit signals that the cost of staying in certain locations was unsustainable given the competitive pricing environment.
To fight back against this rivalry, The Children's Place has initiated a transformation plan, which is a direct action against competitive threats. Here are some key components of that plan:
- Transformation initiative projected to yield over $\mathbf{\$40}$ million in gross benefits over three years.
- Plan includes reducing corporate payroll from $\mathbf{\$120}$ million to below $\mathbf{\$80}$ million by fiscal 2026.
- Inventory levels were reduced by $\mathbf{\$78}$ million year-over-year as of Q2 2025.
- Strategic shift planned from closing stores to opening new ones.
The intensity of rivalry is forcing cost discipline. Finance: draft the projected impact of the $\mathbf{\$40}$ million in gross benefits on the FY2026 SG&A budget by next Tuesday.
The Children's Place, Inc. (PLCE) - Porter's Five Forces: Threat of substitutes
The threat of substitutes for The Children's Place, Inc. remains a significant competitive pressure, driven by lower-cost alternatives and shifting consumer purchasing habits. You see this pressure coming from multiple angles, primarily value-focused options that directly undercut the specialty retailer's price point.
The rise of the pre-owned/second-hand clothing market provides a lower-cost substitute option for parents. This segment is not just growing; it's booming, with the global secondhand apparel market valued at $93.46 billion in 2024 and projected to reach $439.09 billion by 2035. To put that in perspective, resale is expected to grow 11 times faster than the traditional clothing retail industry. For parents managing budgets, finding items up to 70% off retail at resale shops is a powerful substitute for buying new from The Children's Place, Inc..
Private-label brands from mass-market retailers offer direct, low-cost alternatives to The Children's Place's value proposition. In the U.S., the private label market share accounts for 21% of retail sales. Furthermore, the mass market segment, which includes these value-driven store brands, commanded 67.58% of the global children's wear market share in 2024, clearly indicating that affordability is the primary driver for the majority of purchases.
Price sensitivity is a major factor in this dynamic. While the requested specific statistic of 45% of parents prioritizing price over sustainable practices was not confirmed in recent 2025 data, the general environment strongly supports this behavior. For instance, 71% of Gen Z consumers report they sometimes or always buy cheaper alternatives to name brands. This value-seeking behavior limits the ability of The Children's Place, Inc. to implement premium pricing strategies, as parents frequently need to replace rapidly outgrown items.
The market is also seeing growth in substitute products like hybrid and gender-neutral clothing designs. Brands that successfully cater to niche segments, such as gender-neutral clothing, are noted as potentially gaining a competitive edge. Also, the introduction of hybrid styles, like sweatpant jeans that blend the look of denim with loungewear comfort, offers parents functional alternatives that might be sourced elsewhere.
Here's a quick look at the scale of these substitute pressures:
| Substitute Category | Key Metric | Value/Projection |
|---|---|---|
| Second-Hand Apparel Market (Global) | Market Size (2024) | $93.46 billion |
| Second-Hand Apparel Market (Global) | Projected Market Size (2035) | $439.09 billion |
| Children's Wear Market (Global) | Mass Market Segment Share (2024) | 67.58% |
| U.S. Retail Market | Private Label Share (General) | 21% |
| Consumer Behavior (Gen Z) | Buy Cheaper Alternatives | 71% |
The Children's Place, Inc.'s Q1 2025 net sales were $242.1 million, showing the scale of the market they are competing in against these substitutes.
The Children's Place, Inc. (PLCE) - Porter's Five Forces: Threat of new entrants
You're assessing the competitive landscape for The Children's Place, Inc. (PLCE) and the threat posed by new companies entering the fray. Honestly, the threat lands in the moderate zone. Why? Because while digital entry is cheaper, achieving the national scale The Children's Place, Inc. has built requires serious capital and operational heft.
The sheer size of the prize keeps the door ajar for new investment. The global children's apparel market was valued at $284.68 billion in 2025, and analysts project it will climb to $378.95 billion by 2030, growing at a Compound Annual Growth Rate (CAGR) of 5.89%. Even using a more conservative projection, the market is expected to reach $340 billion by 2030. That kind of growth attracts capital, but building a true national omnichannel footprint-the kind The Children's Place, Inc. operates with its mix of physical stores and e-commerce-is a massive undertaking. For context, The Children's Place, Inc.'s Q2 2025 net sales were $298.0 million, and they carry $566.1 million in debt and lease liabilities. That scale is a significant barrier.
Still, the digital-first direct-to-consumer (DTC) brands and eco-friendly startups are definitely changing the calculus. They bypass the massive fixed costs associated with physical retail. For a serious, cut-and-sew DTC fashion brand launch in 2025, a realistic budget range cited is $2,000 to $30,000. This is a fraction of the capital needed to build out a physical presence comparable to The Children's Place, Inc.'s legacy footprint. However, even these leaner models have costs that create friction.
Here's a quick look at the initial capital outlay for a digitally native entrant, showing where the barrier still exists:
| Cost Component | Estimated Range (2025) | Impact on New Entrant |
| Minimum Order Quantity (MOQ) Production | $3,000 to $10,000 | Requires upfront capital before first sale. |
| Custom Website Design | $1,000 to $10,000 | Customization for a unique brand experience is costly. |
| Initial Paid Marketing Budget | $500 to $5,000 per month | Necessary to gain initial traffic in a crowded digital space. |
| Brand Recognition/Visual Identity | $500 to $5,000 | Crucial for standing out in social feeds. |
New entrants must also wrestle with the high cost of building brand recognition and ensuring supply chain compliance, especially given parental focus on safety. The Children's Place, Inc.'s own Gross Profit Margin for FY2025 was 33.15%, which is 8.75 percentage points lower than the apparel retail industry average of 41.9%. This margin pressure suggests that cost of goods sold (COGS) and compliance/sourcing costs are already high, a hurdle new entrants must clear while simultaneously spending on marketing to build awareness.
The key friction points for any new competitor looking to challenge The Children's Place, Inc. at scale include:
- Achieving the necessary inventory scale for national fulfillment.
- Meeting increasingly strict U.S. regulatory safety protocols for children's garments.
- Overcoming The Children's Place, Inc.'s existing scale advantage in North America.
- Securing reliable, compliant, and cost-effective sourcing to compete on price.
- Building a truly seamless omnichannel experience, which The Children's Place, Inc. is actively trying to optimize.
The growth in the premium tier, forecast to grow at a 6.93% CAGR through 2030, shows an area where smaller, focused entrants might find a foothold by targeting affluent, quality-conscious parents, but they still face the capital demands of scaling production.
Disclaimer
All information, articles, and product details provided on this website are for general informational and educational purposes only. We do not claim any ownership over, nor do we intend to infringe upon, any trademarks, copyrights, logos, brand names, or other intellectual property mentioned or depicted on this site. Such intellectual property remains the property of its respective owners, and any references here are made solely for identification or informational purposes, without implying any affiliation, endorsement, or partnership.
We make no representations or warranties, express or implied, regarding the accuracy, completeness, or suitability of any content or products presented. Nothing on this website should be construed as legal, tax, investment, financial, medical, or other professional advice. In addition, no part of this site—including articles or product references—constitutes a solicitation, recommendation, endorsement, advertisement, or offer to buy or sell any securities, franchises, or other financial instruments, particularly in jurisdictions where such activity would be unlawful.
All content is of a general nature and may not address the specific circumstances of any individual or entity. It is not a substitute for professional advice or services. Any actions you take based on the information provided here are strictly at your own risk. You accept full responsibility for any decisions or outcomes arising from your use of this website and agree to release us from any liability in connection with your use of, or reliance upon, the content or products found herein.