
|
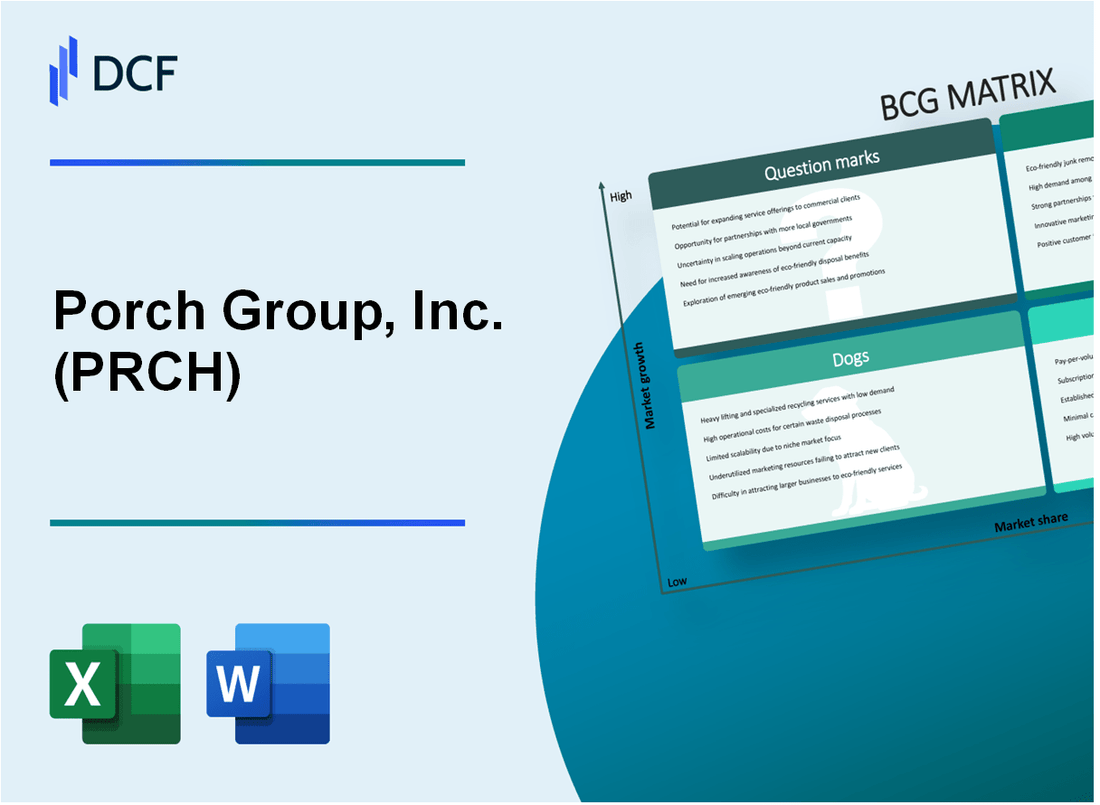
Porch Group, Inc. (PRCH): BCG Matrix [Dec-2025 Updated] |
Fully Editable: Tailor To Your Needs In Excel Or Sheets
Professional Design: Trusted, Industry-Standard Templates
Investor-Approved Valuation Models
MAC/PC Compatible, Fully Unlocked
No Expertise Is Needed; Easy To Follow
Porch Group, Inc. (PRCH) Bundle
You're digging into where Porch Group, Inc. is actually making its money and where it's burning capital for a future payoff as of late 2025. The picture is clear: Insurance Services is the runaway Star, driving a massive 53% Gross Profit jump, while the established Software & Data unit reliably milks out $5.1 million in Adjusted EBITDA as a Cash Cow. Still, you've got the Consumer Services Dog dragging a bit, and a big bet on the Home Factors platform that needs serious investment to become the next big thing. Let's break down this portfolio to see exactly where you should expect cash flow and where the big risks lie below.
Background of Porch Group, Inc. (PRCH)
You're looking at Porch Group, Inc. (PRCH), which you should know is a technology company based in Seattle, Washington, focusing on software platforms for the home services and insurance sectors across the U.S. and Canada. Honestly, the core of the business shifted dramatically at the start of 2025 with the formation of the Porch Reciprocal Exchange (PR) on January 2nd.
This move fundamentally changed Porch Group's risk profile, moving it toward a simpler, higher-margin, commission and fee-based model. The company now reports results primarily through Porch Shareholder Interest (PSI), which includes its operating segments-Insurance Services, Software & Data, and Consumer Services-consolidated with the Reciprocal Segment for reporting purposes.
The Insurance Services segment, powered by the Reciprocal, is the current engine. For instance, in the second quarter of 2025, this segment alone pulled in $67.4 million in revenue, showing an impressive 86% gross margin. This segment's success is now directly tied to growing premiums within the Reciprocal.
The Software & Data segment, while facing headwinds from a soft housing market, still provides strategic advantages. In Q2 2025, this segment brought in $24.0 million in revenue, a 4% year-over-year lift, achieving an Adjusted EBITDA margin of 23%. To be fair, the company is investing here, expecting this segment to support higher growth in 2026 and beyond.
Financially, Porch Group showed a significant turnaround in 2025. For Q2 2025, PSI revenue hit $107.0 million, and the company reported a net income attributable to Porch of $2.6 million, marking a return to profitability. Adjusted EBITDA for that quarter was $15.6 million, representing a 15% margin, a huge improvement over the prior year.
A key asset supporting the insurance side is the Home Factors property intelligence platform, which now covers about 90% of U.S. homes with over 100 attributes. This data expansion is crucial, as it helps carriers with underwriting precision and risk segmentation, showing marked improvement in ROI year-to-date.
Given the strong mid-year performance, Porch Group raised its full-year 2025 guidance. Management is now targeting PSI revenue in the range of $405 million to $425 million, with the midpoint of the raised Adjusted EBITDA guidance set between $65 million and $70 million.
Porch Group, Inc. (PRCH) - BCG Matrix: Stars
You're looking at the engine driving Porch Group, Inc.'s current momentum, which clearly sits in the Star quadrant: high market share in a high-growth area. For Porch Group, Inc., that's the Insurance Services segment.
Insurance Services is the primary growth engine, driving a 53% increase in Gross Profit year-over-year in Q3 2025. This growth is substantial, representing a $32.5 million increase in Porch Shareholder Interest Gross Profit compared to Q3 2024 consolidated Gross Profit of $61.7 million. This business unit is leading the charge, which is exactly what you want from a Star-it's capturing market share in a growing space.
The profitability metrics for this segment are impressive. Segment Adjusted EBITDA margin is a strong 34%, generating $25.3 million in Q3 2025. This segment brought in $73.8 million in revenue for Porch Shareholder Interest during the quarter. Honestly, seeing that margin while still in a high-growth investment phase is a great sign.
Here's a quick look at the key performance indicators for the Insurance Services segment in Q3 2025:
- Insurance Services Revenue: $73.8 million
- Segment Adjusted EBITDA: $25.3 million
- Segment Adjusted EBITDA Margin: 34%
- Reciprocal Written Premium (RWP): $137.5 million
- RWP per policy: $2,884
The strategic foundation supporting this growth is the capital position of the insurance entity. The Porch Reciprocal Exchange surplus reached $412.0 million in Q3 2025, which was a sequential increase of approximately $113 million from Q2 2025. This capital build is critical; management noted this surplus level could potentially support up to $2 billion in RWP, which, at an 18% conversion rate, could generate around $360 million in Insurance Services Adjusted EBITDA down the line. This creates capacity for rapid premium scaling in 2026.
The operational metrics confirm the high market share capture. Strategic focus on new agency appointments and quoting activity ensures continued high market share gains. During the quarter, Porch Group wrote 47,700 reciprocal policies. The overall Porch Shareholder Interest generated an Adjusted EBITDA of $20.6 million in Q3 2025, showing that the Star segment is heavily contributing to the overall profitability.
You can see how the Insurance Services performance stacks up against the other segments in the Porch Shareholder Interest results for the quarter:
| Metric (Q3 2025, $ in millions) | Insurance Services | Software & Data | Consumer Services | Corporate | Porch Shareholder Interest Total |
| Revenue | 73.8 | 24.6 | 19.4 | (2.8) | 115.1 |
| Gross Profit | 62.3 | 18.2 | 16.6 | (2.8) | 94.2 |
| Adjusted EBITDA | 25.3 | 5.1 | 2.5 | (23.3) | 20.6 |
If Porch Group, Inc. can maintain this success as the overall insurance market growth rate eventually slows, this segment is definitely positioned to transition into a Cash Cow, providing the necessary stable cash flow to fund other areas of the business. Finance: draft the 2026 capital allocation plan prioritizing Reciprocal surplus growth by end of Q4.
Porch Group, Inc. (PRCH) - BCG Matrix: Cash Cows
You're looking at the core stability engine of Porch Group, Inc. (PRCH) here, the segment that fits the Cash Cow profile perfectly: high market share in a mature, sticky niche, generating more cash than it needs for maintenance. This is the business unit we rely on to fund the growth plays-the Question Marks-and cover the corporate overhead. For Porch Group, Inc., that stability comes from the Software & Data segment.
The Software & Data segment provides stable, high-margin revenue with a Q3 2025 gross margin of 74%. That kind of margin profile in a mature software offering signals strong pricing power and low cost of goods sold relative to revenue. This segment delivered $5.1 million in Adjusted EBITDA in Q3 2025, making it a reliable cash contributor to the overall Porch Group, Inc. structure. Honestly, these are the numbers you want to see from a segment that isn't expected to explode in growth.
The customer base here is defintely sticky, serving an established base of 23,800 companies with vertical software solutions. When you have that many entrenched users, the cost to acquire new ones drops, and the revenue becomes highly predictable. Growth, as expected for a Cash Cow, is moderate at 7% year-over-year in Q3 2025, which is solid for a mature niche and shows the platform still has room to grow within its existing customer set, perhaps through upselling new features like the AI integration mentioned in their commentary.
We should look closely at the key performance indicators for this segment from the third quarter of 2025 to see exactly how it's milking those gains. Investments here are focused on efficiency improvements, like product innovation, rather than massive market expansion spending.
| Metric | Value (Q3 2025) | Context |
| Revenue | $24.6 million | Total revenue generated for Porch Shareholder Interest. |
| Gross Profit | $18.2 million | Direct profit before operating expenses. |
| Gross Margin | 74% | Indicates high profitability on services rendered. |
| Adjusted EBITDA | $5.1 million | Cash flow contribution before corporate allocation. |
| Customer Count | 23,800 companies | Represents the established, sticky user base. |
| Year-over-Year Growth | 7% | Moderate growth in a mature market. |
The strategy for a Cash Cow like this is clear: maintain the infrastructure to keep the high margins and extract the steady cash flow. Here's what that maintenance focus looks like in practice:
- Maintain high gross margin through efficient service delivery.
- Invest selectively in product innovation, such as AI integration.
- Focus on retaining the 23,800 company base.
- Ensure the $5.1 million Adjusted EBITDA is reliably delivered.
- Manage operating expenses to maximize cash conversion.
The annualized average revenue per company for this segment was $4,140 in Q3 2025. That number, combined with the 7% growth, shows you that even a mature business unit can still find ways to increase revenue per user without needing massive market share swings. Finance: draft the 13-week cash view by Friday, focusing on the expected $5.1 million quarterly contribution from this segment.
Porch Group, Inc. (PRCH) - BCG Matrix: Dogs
Dogs are units or products with a low market share and low growth rates. They frequently break even, neither earning nor consuming much cash. Dogs are generally considered cash traps because businesses have money tied up in them, even though they bring back almost nothing in return. These business units are prime candidates for divestiture.
Consumer Services has the lowest relative profitability within Porch Group, with Q3 2025 Adjusted EBITDA of only $2.5 million. Performance for this segment is constrained by the current trough in housing market activity, which acts as a significant external headwind. Honestly, you can see how transactional segments struggle when the underlying transaction volume is low.
Here's the quick math on the Consumer Services segment's Q3 2025 results, which clearly shows its lower profitability profile compared to the Insurance Services segment:
| Metric | Value ($ millions) | Margin/Rate |
| Revenue | $19.4 | n/a |
| Gross Profit | $16.6 | 86% |
| Adjusted EBITDA | $2.5 | 13% |
| Monetized Services | 93,900 | n/a |
| Avg. Revenue per Service | n/a | $206 |
The warranty business, a key part of this segment, experienced lower claims activity compared to the prior year. Still, the segment's overall contribution to consolidated profitability remains modest. This transactional segment offers limited strategic upside and is a candidate for harvest or optimization, given the external market conditions.
When you look at the characteristics aligning this segment with the Dog quadrant, the data points to a clear need for strategic review:
- Reported Adjusted EBITDA of $2.5 million.
- Adjusted EBITDA Margin was only 13% for the quarter.
- Revenue growth was 9% year-over-year, suggesting low growth relative to the high-growth Insurance Services segment.
- The segment is highly dependent on housing transaction volume.
- Warranty claims activity was lower than the prior year, which helped profitability but doesn't change the low-growth market position.
Finance: draft potential harvest scenarios for Consumer Services by end of Q4 2025.
Porch Group, Inc. (PRCH) - BCG Matrix: Question Marks
You're looking at the growth engine that hasn't quite hit its stride yet-the Question Marks. For Porch Group, Inc., this quadrant is heavily influenced by the trajectory of its data and software assets, which are inherently high-growth but currently demand significant cash to secure market share against established players.
The expanded Home Factors property intelligence platform covers 90% of U.S. homes, a massive data opportunity. By the end of 2025, the plan is to offer about 100 specific attributes, up from 89 attributes reported in Q3 2025. This data depth is proving its worth; for instance, the platform is currently recording around a 1,054% return on investment (ROI) in a regional home improvement brand, and analysis demonstrated a projected ROI greater than 20x across multiple insurance carriers. This intelligence helps identify segments with about a 23% to 50% higher chance of loss ratio.
These assets require continued, significant investment in AI-driven underwriting and data validation to prove their long-term ROI. The high-growth potential is clear, but the current financial contribution from the Software & Data segment, while growing, still positions it as a cash consumer relative to the Insurance Services segment.
Here's a quick look at the Q3 2025 segment performance for context:
| Metric ($ in millions) | Insurance Services | Software & Data | Consumer Services |
| Revenue | 73.8 | 24.6 | 19.4 |
| Gross Profit | 62.3 | 18.2 | 16.6 |
| Adjusted EBITDA | 25.3 | 5.1 | 2.5 |
The Software & Data segment posted revenue of $24.6 million in Q3 2025, representing a 7% year-over-year growth rate, and generated an Adjusted EBITDA of $5.1 million with a 21% margin. This segment serves 23,800 companies, yielding an annualized average revenue per company of $4,140. Still, this segment's growth rate of 7% lags behind the Insurance Services segment's revenue growth, which is not explicitly stated but is the primary driver.
Management is prioritizing Reciprocal surplus generation through Q4 2025 to fund premium scaling in 2026, a high-risk, high-reward capital allocation. The Reciprocal's surplus combined with non-admitted assets grew to $412.0 million at the end of Q3 2025, marking a sequential increase of approximately $113 million from Q2 2025. This capital base, with an approximate premium-to-surplus ratio of 5:1, could potentially support up to $2 billion in Reciprocal Written Premium (RWP). At the current 18% conversion rate from RWP to Insurance Services Adjusted EBITDA, this represents a profit potential of around $360 million in that segment's Adjusted EBITDA.
Success here could transform the Software & Data segment into a Star, but it's defintely not a sure thing yet. The entire Porch Group, Inc. raised its full-year 2025 Adjusted EBITDA guidance midpoint to $70 million, up from prior guidance, with a revenue range of $410 million to $420 million. The path forward for the data assets involves a critical choice:
- Invest heavily to accelerate adoption and market share capture.
- Divest if the required investment does not yield a path to Star status quickly.
The current strategy leans toward heavy investment, evidenced by the focus on surplus generation to fuel future premium scaling in 2026 rather than maximizing immediate premium growth in Q4 2025.
Disclaimer
All information, articles, and product details provided on this website are for general informational and educational purposes only. We do not claim any ownership over, nor do we intend to infringe upon, any trademarks, copyrights, logos, brand names, or other intellectual property mentioned or depicted on this site. Such intellectual property remains the property of its respective owners, and any references here are made solely for identification or informational purposes, without implying any affiliation, endorsement, or partnership.
We make no representations or warranties, express or implied, regarding the accuracy, completeness, or suitability of any content or products presented. Nothing on this website should be construed as legal, tax, investment, financial, medical, or other professional advice. In addition, no part of this site—including articles or product references—constitutes a solicitation, recommendation, endorsement, advertisement, or offer to buy or sell any securities, franchises, or other financial instruments, particularly in jurisdictions where such activity would be unlawful.
All content is of a general nature and may not address the specific circumstances of any individual or entity. It is not a substitute for professional advice or services. Any actions you take based on the information provided here are strictly at your own risk. You accept full responsibility for any decisions or outcomes arising from your use of this website and agree to release us from any liability in connection with your use of, or reliance upon, the content or products found herein.