
|
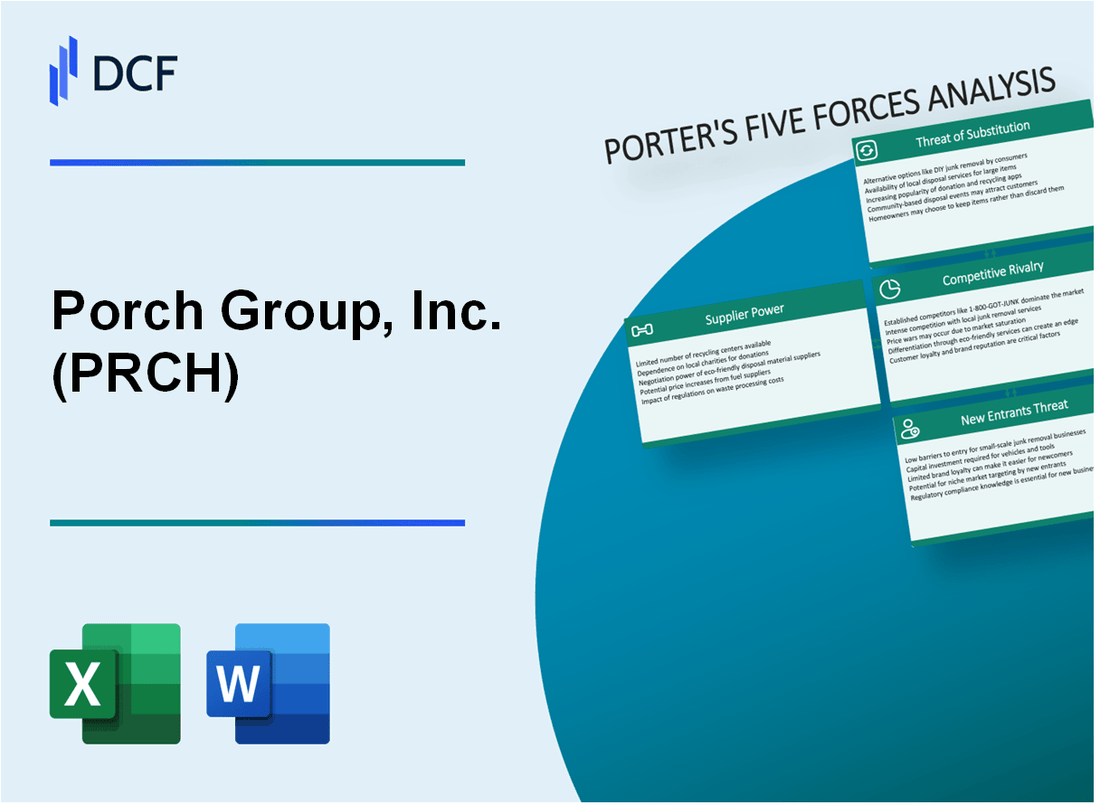
Porch Group, Inc. (PRCH): 5 FORCES Analysis [Nov-2025 Updated] |
Fully Editable: Tailor To Your Needs In Excel Or Sheets
Professional Design: Trusted, Industry-Standard Templates
Investor-Approved Valuation Models
MAC/PC Compatible, Fully Unlocked
No Expertise Is Needed; Easy To Follow
Porch Group, Inc. (PRCH) Bundle
You're looking for a clear breakdown of Porch Group's competitive position, and honestly, their pivot to a high-margin, fee-based insurance model changes everything about these forces. The Q3 2025 results confirm this strategy is yielding high-quality revenue, showing a $\mathbf{82\%}$ gross margin on $\mathbf{\$115.1}$ million in revenue, while the leadership is strategically building capacity by growing the Reciprocal surplus to $\mathbf{\$412.0}$ million to support 2026 scaling. Still, that $\mathbf{2.84}$ stock beta tells you the market sees the high-stakes execution required to navigate this pivot against established players, so let's map out exactly where Porch Group stands across all five of Michael Porter's lenses below.
Porch Group, Inc. (PRCH) - Porter's Five Forces: Bargaining power of suppliers
When you look at the supplier side of the equation for Porch Group, Inc. (PRCH), you see a mix of dependencies that the management team is actively working to balance. The power of a supplier hinges on how essential they are and how many alternatives you have. For a company that posted Q3 2025 revenue of $115.1 million and is guiding toward an Adjusted EBITDA of $70 million for the full year, managing these relationships is key to hitting those margin targets.
The distribution network is a major area where suppliers-in this case, independent insurance agencies-hold sway. Porch Group, Inc. is aggressively expanding its distribution through these third parties to scale its insurance premiums, a growth engine they restarted in late 2024. This reliance gives those agencies leverage in negotiations or partnership terms. For example, new partnerships with Roamly Insurance Group and Evertree Insurance Services show this dynamic in action:
- Roamly is appointed in 19 states for the Porch Reciprocal Exchange.
- Evertree is officially appointed in 15 states.
- Porch Group seeks to be a key partner for the largest insurance agencies in the country.
On the flip side, the power of reinsurance suppliers-those who backstop the underwriting risk-is demonstrably lower due to Porch Group, Inc.'s proactive diversification. Following the issues with a legacy partner, the company rebuilt its panel to be much more resilient. This is a clear win for controlling input costs and risk exposure. Here's a quick look at the reinsurance strength:
| Metric | Data Point (Late 2025) | Implication for Supplier Power |
|---|---|---|
| Number of A-rated Reinsurance Partners | More than 40 | High diversification mitigates power of any single reinsurer. |
| Reinsurance Renewal Terms (April 2025) | Better terms and lower costs | Porch Group, Inc. successfully negotiated favorable terms. |
| Reciprocal Exchange Surplus (Q3 2025) | $152 million (Statutory Surplus) | Strong internal capital reduces reliance on external capital support. |
Now, let's talk about the software side. While Porch Group, Inc. has its own vertical software solutions, it still relies on other technology providers for certain functions. For instance, the penetration of home inspection software in the market suggests that key vendors in that space have established market positions, which naturally translates into some pricing power. We know that Porch Group, Inc.'s own home inspection software is used by over 40% of inspection companies, which is a strong position for Porch, but it also shows the market segment is mature enough for established players to command terms.
The most significant lever Porch Group, Inc. has against generic third-party data suppliers is its proprietary Home Factors data. This is where they turn a potential cost center into a competitive advantage. By developing unique data sets, they reduce the need to pay premium prices for less granular, off-the-shelf information. This proprietary intelligence is what drives their advantaged underwriting. If onboarding takes 14+ days, churn risk rises, but good data shortens that cycle.
- Home Factors attributes planned for release by year-end 2025: 100.
- U.S. property coverage achieved by Home Factors: Approximately 90%.
- Projected ROI for insurance carriers testing the data: Greater than 20x.
- Data points collected on homes: 89 home characteristics.
The ability to offer data that has shown an ROI greater than 20x in testing across multiple carriers gives Porch Group, Inc. significant leverage when negotiating with potential data partners or when deciding to build in-house versus buying external feeds. Finance: draft 13-week cash view by Friday.
Porch Group, Inc. (PRCH) - Porter's Five Forces: Bargaining power of customers
When you look at Porch Group, Inc. (PRCH), the power of the customer really depends on which customer you are talking about-the homeowner, the service professional, or the insurance carrier buying the data. Honestly, for the individual homeowner buying a single service, their power is quite high.
Homeowners have low switching costs for single services like moving or insurance, keeping customer power high. If a homeowner just needs a moving company or a specific insurance policy, jumping to a competitor is usually straightforward. Still, Porch Group is pushing a bundled approach to lock people in. The friction to switch increases when you have multiple services tied together, even if the individual components are easy to leave. The company's Q3 2025 revenue breakdown shows the scale of these different customer interactions.
| Customer/Buyer Type Interaction | Segment | Q3 2025 Revenue ($ millions) | Q3 2025 Gross Profit ($ millions) |
|---|---|---|---|
| Homeowners (Direct Services) | Consumer Services | 19.4 | 16.6 |
| Homeowners (Insurance) | Insurance Services | 73.8 | 62.3 |
| Service Professionals (SaaS) | Software & Data | 24.6 | 18.2 |
The bundled offering (insurance, moving, warranty) raises the friction for customers to switch, though. By integrating the insurance policy, which is a high-value, sticky product, with the move-in services, Porch Group makes the total package more inconvenient to unravel. To be fair, the Insurance Services segment was the biggest earner in Q3 2025, bringing in $73.8 million in revenue, which anchors the bundle. The Consumer Services part, which includes moving, was $19.4 million in revenue.
Now, let's look at the service professionals who use the software tools. Over 30,000 home service professionals use the software, but they can definitely choose other SaaS providers. The actual reported number of companies served by the Software & Data segment in Q3 2025 was 23,800 entities. These are sophisticated buyers in their own right, and they can easily move to a different platform if the value proposition shifts. The Software & Data segment generated $24.6 million in revenue for the quarter, showing they have a solid base, but the market for this kind of B2B software is competitive.
The dynamic shifts again when you consider the insurance carriers buying Porch Group's data. These carriers can negotiate hard as they are large, sophisticated buyers. Porch Group's strategy relies on these carriers adopting their proprietary data, like the 'Home Factors' product, which covers data points on approximately 90% of U.S. homes. The company is actively working to monetize this data, with expectations set for 2027. The leverage of these large carriers is a near-term risk, as adoption dictates the growth of the data business, which is a key part of the overall strategy, even though Insurance Services revenue was $73.8 million in Q3 2025.
- Home Factors platform collects data on 89 home characteristics.
- The company anticipates reaching $70 million in Adjusted EBITDA for the full year 2025.
- The Reciprocal Surplus combined with non-admitted assets reached $412 million by the end of Q3 2025.
- Porch Shareholder Interest Cash Flow from Operations was $28.8 million in Q3 2025.
Finance: draft a sensitivity analysis on data licensing revenue based on a 10% reduction in carrier adoption rates by year-end 2026.
Porch Group, Inc. (PRCH) - Porter's Five Forces: Competitive rivalry
You're looking at Porch Group, Inc. (PRCH) in a market where the fight for market share is definitely heating up. The rivalry here is intense, pitting Porch Group against established, traditional insurers alongside nimble InsurTech players like Hippo and Kin. This isn't a slow-moving industry; it's a high-stakes arena where every customer acquisition matters.
Still, the numbers suggest Porch Group, Inc. isn't just playing the price game. Look at the consolidated gross margin for Porch Shareholder Interest in Q3 2025, which landed at a strong 82%. That high figure hints at a model that's differentiated, perhaps through its integrated software and data offerings, making it less susceptible to pure price competition than a standard carrier might be. To be fair, the segment margins tell a more granular story about where that strength comes from.
Here's a quick look at the margin profile from the Q3 2025 results, which you can use to map out where the differentiation is strongest:
| Segment | Q3 2025 Revenue (USD Millions) | Q3 2025 Gross Margin | Q3 2025 Adjusted EBITDA Margin |
|---|---|---|---|
| Insurance Services | 73.8 | 84% | 34% |
| Software & Data | 24.6 | 74% | 21% |
| Consumer Services | 19.4 | 86% | 13% |
| Consolidated (Shareholder Interest) | 115.1 | 82% | 18% |
Beyond the insurance side, Porch Group, Inc. has to fight for mindshare and wallet share against vertical software rivals, especially in areas like home inspection services, and also against large home services marketplaces. The Software & Data segment, which supports these verticals, serves 23,800 companies as of Q3 2025. That number shows the scale of their installed base, but it also shows the number of potential competitors vying for those same software dollars, with an annualized average revenue per company around $4,140.
The market's perception of this competitive environment is baked right into the stock price action. The stock volatility, reflected in a recent beta of 2.84, is a clear signal. That high beta suggests Porch Group, Inc. is trading with significantly more volatility than the broader market, which is exactly what you'd expect from a company in a high-growth, high-stakes rivalry where the outcome isn't yet certain.
You can see the competitive pressure reflected in a few key operational metrics:
- Reciprocal Written Premium (RWP) reached $138 million in Q3 2025.
- Gross Profit grew 53% year-over-year in Q3 2025 to $94.2 million.
- Adjusted EBITDA for Q3 2025 was $20.6 million, an 18% margin.
- Cash flow from operations for shareholders was $28.8 million in the quarter.
Honestly, managing this rivalry means constantly proving the value of the integrated platform over point solutions.
Finance: draft a sensitivity analysis on gross margin if the average segment margin drops by 200 basis points by Q1 2026.
Porch Group, Inc. (PRCH) - Porter's Five Forces: Threat of substitutes
Non-integrated substitutes like using a traditional insurer and a separate moving company are readily available. You see this fragmentation everywhere in the home services and insurance space; a homeowner might use a national carrier for their policy and then separately source quotes from three different local contractors for the move itself. This is the baseline competition Porch Group, Inc. faces.
The unique data-driven underwriting is a key differentiator, making direct substitution of the insurance product hard. Porch Group, Inc. leverages its HomeFactors platform, which analyzes unique data points on properties nationwide. This data-driven approach allows for pricing policies with what management describes as surgical precision. For instance, analysis with third-party carriers showed that properties with water intrusion damage, identified via Home Factors, have more than 40% higher claims frequency. Porch Group, Inc. plans to have over 100 such attributes available by the end of 2025. This proprietary data creates a moat, as rivals relying on traditional underwriting methods cannot easily replicate this risk assessment capability.
The platform's convenience as a single point for home services is the main defense against fragmented substitutes. By embedding insurance within a broader ecosystem that includes home services, Porch Group, Inc. increases switching costs. In Q3 2025, insurance services accounted for 64% of revenue, while software and data made up 21%. This integration makes the value proposition stickier than a standalone insurance offering.
Porch Group, Inc.'s full-year 2025 revenue target of $415.0 million shows the platform is capturing significant market share. The company actually raised its Porch Shareholder Interest revenue guidance to a range of $400 million to $420 million for fiscal year 2025, with a midpoint of $410 million. This guidance increase followed a strong Q1 2025 where revenue reached $84.5 million.
Here's a quick look at some of the key financial metrics supporting the platform's performance against substitutes as of late 2025:
| Metric | Value (Latest Reported/Guidance) | Period/Context |
| FY 2025 Revenue Guidance Midpoint | $410 million | Porch Shareholder Interest |
| Q3 2025 Revenue | $115.1 million | Porch Shareholder Interest |
| Q3 2025 Adjusted EBITDA | $20.6 million | Porch Shareholder Interest |
| FY 2025 Adjusted EBITDA Target | $70 million | Full Year Expectation |
| Q1 2025 Gross Margin | 82% | Porch Shareholder Interest |
| Reciprocal Written Premium (RWP) | $138 million | Q3 2025 |
The data-driven underwriting, which has reportedly cut loss ratios in half for Porch Group, Inc., directly challenges the substitute threat by offering superior risk-adjusted pricing compared to traditional carriers.
- Proprietary data has improved loss ratios, cutting them in half.
- Reciprocal Surplus and non-admitted assets reached $412 million in Q3 2025.
- The company aims to grow premiums from $500 million (2025 target) to $3 billion long-term.
- The current market capitalization is around $1.17 billion.
The platform's ability to manage the entire transaction, from inspection data to service provider matching and insurance binding, provides a level of integration that fragmented substitutes cannot match.
Porch Group, Inc. (PRCH) - Porter's Five Forces: Threat of new entrants
When you look at the insurance and vertical software space, the threat of new entrants for Porch Group, Inc. (PRCH) is significantly muted by structural advantages that require massive upfront investment and time to replicate. A new player can't just decide to compete tomorrow; they have to build capital reserves, develop proprietary data sets, and navigate a complex regulatory maze.
Significant capital is required for the insurance segment, with the Reciprocal surplus reaching $412 million in Q3 2025. This figure represents the capital base of the Porch Reciprocal Exchange, which is consolidated for reporting purposes, and it's a direct measure of the financial muscle needed to write policies and absorb unexpected losses. Building this level of surplus takes years of retained earnings or massive capital injections, which immediately raises the entry cost for any competitor wanting to operate at a meaningful scale in the homeowners insurance market. For context, this surplus level is a key enabler for future premium scaling, as management noted it establishes a strong foundation for growth into 2026 and beyond.
Integrating software into the workflows of home inspectors and realtors creates a high barrier to entry. This isn't just about having an app; it's about embedding yourself into the transaction process. Porch Group, Inc. (PRCH) has achieved deep workflow integration, with its Inspection Support Network (ISN) and other brands processing approximately 40% of all U.S. home inspections in 2023. Furthermore, over 40% of inspection companies use their home inspection software. This level of adoption means that for a new entrant to displace them, they would need to convince a massive portion of the existing inspection workforce to switch platforms, which is a huge undertaking in a relationship-driven field. You're hiring before product-market fit... but here, Porch Group, Inc. (PRCH) has already achieved product-market workflow fit with a large segment of the industry.
Proprietary data assets covering around 90% of US homes are a powerful, defensible asset. Porch Group, Inc. (PRCH) has built its 'Home Factors' platform to collect unique data points-they plan to have over 100 attributes available by the end of 2025. This data advantage is what drives their 'advantaged underwriting,' leading to loss ratios that have been cut in half compared to prior periods. A new entrant would need years and substantial investment to amass a comparable, high-fidelity dataset covering this breadth of U.S. properties.
Regulatory hurdles in the insurance sector slow down any potential new entrants. Operating an insurance entity, even a reciprocal exchange, is heavily scrutinized. New entrants face uncertainties related to regulatory approval of insurance rates, policy forms, insurance products, and license applications. Navigating the state-by-state insurance regulatory environment is time-consuming and expensive, creating a significant time-to-market delay that a software-first company like Porch Group, Inc. (PRCH) can use to solidify its position.
Here's a quick look at how these factors stack up as barriers:
| Barrier Factor | Specific Metric/Data Point for Porch Group, Inc. (PRCH) | Implication for New Entrants |
|---|---|---|
| Insurance Capital Requirement | Reciprocal Surplus: $412.0 million (Q3 2025) | Requires immediate, massive capital base to operate and scale legally. |
| Workflow Integration/Switching Costs | Approx. 40% of U.S. home inspections processed via ISN/Porch brands (2023) | High friction to displace entrenched software used by key transaction partners. |
| Data Defensibility | Proprietary data coverage for approx. 90% of U.S. homes | Requires years of data collection and AI model development to match underwriting edge. |
| Regulatory Compliance | Need for state-by-state approval on rates, forms, and licenses | Creates significant time delays and ongoing operational complexity. |
The combination of deep software entrenchment and the sheer capital required for the insurance side means that while the market is large, the path for a new, direct competitor to replicate Porch Group, Inc. (PRCH)'s integrated model is steep.
- Focus on software adoption: ISN app usage increased by 45% in the first two months after a recent release.
- Data monetization success: Home Factors platform demonstrated an ROI greater than 20x for some insurance carriers.
- Capital generation: Reciprocal surplus increased by $112.8 million from Q2 2025 to Q3 2025 alone.
Finance: draft 13-week cash view by Friday.
Disclaimer
All information, articles, and product details provided on this website are for general informational and educational purposes only. We do not claim any ownership over, nor do we intend to infringe upon, any trademarks, copyrights, logos, brand names, or other intellectual property mentioned or depicted on this site. Such intellectual property remains the property of its respective owners, and any references here are made solely for identification or informational purposes, without implying any affiliation, endorsement, or partnership.
We make no representations or warranties, express or implied, regarding the accuracy, completeness, or suitability of any content or products presented. Nothing on this website should be construed as legal, tax, investment, financial, medical, or other professional advice. In addition, no part of this site—including articles or product references—constitutes a solicitation, recommendation, endorsement, advertisement, or offer to buy or sell any securities, franchises, or other financial instruments, particularly in jurisdictions where such activity would be unlawful.
All content is of a general nature and may not address the specific circumstances of any individual or entity. It is not a substitute for professional advice or services. Any actions you take based on the information provided here are strictly at your own risk. You accept full responsibility for any decisions or outcomes arising from your use of this website and agree to release us from any liability in connection with your use of, or reliance upon, the content or products found herein.