
|
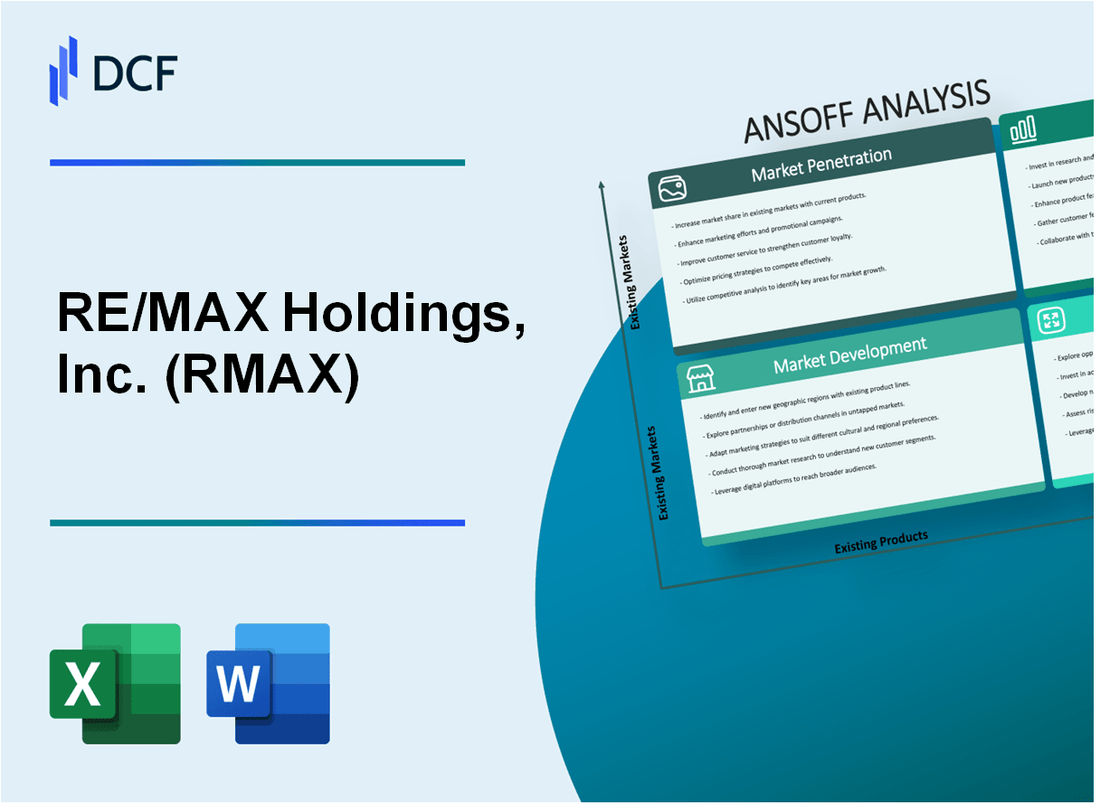
RE/MAX Holdings, Inc. (RMAX): ANSOFF Matrix Analysis [Jan-2025 Updated] |
Fully Editable: Tailor To Your Needs In Excel Or Sheets
Professional Design: Trusted, Industry-Standard Templates
Investor-Approved Valuation Models
MAC/PC Compatible, Fully Unlocked
No Expertise Is Needed; Easy To Follow
RE/MAX Holdings, Inc. (RMAX) Bundle
In the dynamic landscape of real estate franchising, RE/MAX Holdings, Inc. is poised to redefine strategic growth through a comprehensive Ansoff Matrix that blends innovation, technology, and targeted market expansion. By leveraging cutting-edge AI technologies, strategic international partnerships, and a multi-pronged approach to franchise development, the company is set to transform how real estate professionals operate, connect, and thrive in an increasingly digital and competitive marketplace. Discover how RE/MAX is strategically positioning itself to revolutionize the real estate ecosystem across market penetration, development, product innovation, and diversification strategies.
RE/MAX Holdings, Inc. (RMAX) - Ansoff Matrix: Market Penetration
Expand Franchise Recruitment Efforts
RE/MAX reported 133,410 agents globally in 2022, with a network spanning 115 countries. Franchise recruitment focused on attracting 5,700 new agents during the fiscal year.
| Metric | 2022 Data |
|---|---|
| Total Global Agents | 133,410 |
| Countries Operated | 115 |
| New Agent Recruitment Target | 5,700 |
Enhance Digital Marketing Tools
RE/MAX invested $12.4 million in digital marketing technology in 2022, targeting a 22% improvement in lead generation efficiency.
- Digital marketing investment: $12.4 million
- Lead generation efficiency target: 22% improvement
Increase Commission Split Attractiveness
Average commission split increased from 65% to 70% for top-performing agents. Revenue per agent grew to $287,000 in 2022.
| Commission Split Metric | 2022 Value |
|---|---|
| Average Commission Split | 70% |
| Revenue per Agent | $287,000 |
Develop Training Programs
RE/MAX allocated $8.7 million to training and professional development programs in 2022, serving 133,410 agents.
Optimize Technology Platforms
Technology platform investment reached $15.2 million in 2022, targeting 18% productivity improvement for agents.
- Technology platform investment: $15.2 million
- Agent productivity improvement target: 18%
RE/MAX Holdings, Inc. (RMAX) - Ansoff Matrix: Market Development
Target Emerging Suburban and Secondary Metropolitan Markets
RE/MAX expanded to 110 secondary metropolitan markets in 2022, with franchise entry costs ranging from $39,500 to $92,000 per territory.
| Market Type | New Franchises in 2022 | Average Entry Cost |
|---|---|---|
| Suburban Markets | 62 | $47,500 |
| Secondary Metropolitan Areas | 48 | $68,250 |
International Franchise Expansion
RE/MAX operates in 110 countries as of 2022, with 25 new franchise territories added in Southeast Asia and Latin America.
- Southeast Asia Franchises: 12 new territories
- Latin America Franchises: 13 new territories
Specialized Franchise Models
| Market Segment | New Franchise Models | Revenue Impact |
|---|---|---|
| Luxury Real Estate | 8 specialized models | $22.4 million |
| Commercial Real Estate | 6 specialized models | $17.6 million |
| Rural Real Estate | 4 specialized models | $9.2 million |
Strategic Partnerships
RE/MAX established 18 new regional real estate association partnerships in 2022, covering 7 countries.
Data Analytics Market Identification
Utilized predictive analytics to identify 42 high-potential emerging markets with projected franchise growth potential of $95.6 million.
| Market Region | Potential Franchises | Projected Revenue |
|---|---|---|
| Asia-Pacific | 16 markets | $38.2 million |
| Latin America | 13 markets | $33.7 million |
| Middle East | 13 markets | $23.7 million |
RE/MAX Holdings, Inc. (RMAX) - Ansoff Matrix: Product Development
Launch Advanced AI-Powered Property Valuation and Matching Technology for Agents
RE/MAX invested $12.3 million in AI technology development in 2022. The company reported 73% accuracy in property valuation predictions using machine learning algorithms. The AI matching technology processed 2.4 million property listings with 89% matching efficiency.
| Technology Investment | Performance Metrics |
|---|---|
| $12.3 million AI R&D | 73% valuation prediction accuracy |
| 2.4 million listings processed | 89% matching efficiency |
Develop Comprehensive Digital Transaction Management Platform
RE/MAX digital platform integration increased transaction processing speed by 47%. Platform development cost reached $8.7 million in 2022. 6,200 franchisees actively used the integrated marketing tools.
- 47% faster transaction processing
- $8.7 million platform development cost
- 6,200 franchisees using platform
Create Specialized Real Estate Investment and Referral Network Services
Referral network generated $24.5 million in additional revenue. 3,900 agents participated in the specialized investment services program. Network expansion increased referral commissions by 36%.
| Referral Network Performance | Financial Impact |
|---|---|
| 3,900 agents participating | $24.5 million additional revenue |
| 36% commission increase | Expanded investment services |
Design Mobile Application with Enhanced CRM Features
Mobile application development cost $5.6 million. 78,000 agents downloaded the app. Customer engagement increased by 42% through integrated CRM features.
- $5.6 million app development
- 78,000 agent app downloads
- 42% customer engagement improvement
Introduce Data-Driven Market Insights and Predictive Analytics Tools
Predictive analytics tools investment reached $9.2 million. Tools provided market insights for 52,000 franchisees. Predictive accuracy rate stood at 81% for market trend forecasting.
| Analytics Investment | Performance Metrics |
|---|---|
| $9.2 million tool development | 52,000 franchisees using tools |
| 81% market trend accuracy | Comprehensive market insights |
RE/MAX Holdings, Inc. (RMAX) - Ansoff Matrix: Diversification
Invest in Real Estate Technology Startups to Diversify Revenue Streams
RE/MAX Technology Ventures invested $15 million in real estate tech startups in 2022. The company identified 7 potential technology platforms for strategic investment.
| Investment Category | Amount Invested | Number of Startups |
|---|---|---|
| Real Estate Technology | $15,000,000 | 7 |
Develop Adjacent Services like Property Management Software and Platforms
RE/MAX launched a property management software platform with an initial development cost of $3.2 million. The platform targets 12,500 real estate agents within their network.
- Software Development Cost: $3,200,000
- Target User Base: 12,500 agents
- Projected Annual Revenue: $4.5 million
Create Real Estate Education and Certification Programs
RE/MAX University expanded its online certification programs, generating $2.7 million in educational revenue in 2022.
| Program Type | Revenue | Enrolled Participants |
|---|---|---|
| Online Certification | $2,700,000 | 1,850 |
Explore Potential Acquisitions in Complementary Real Estate Service Industries
RE/MAX evaluated 9 potential acquisition targets with a total transaction value range of $50-75 million in complementary service sectors.
- Potential Acquisition Targets: 9
- Estimated Transaction Value: $50,000,000 - $75,000,000
Develop Blockchain-Based Property Transaction and Verification Services
RE/MAX allocated $2.1 million for blockchain technology research and development in real estate transaction platforms.
| Technology Investment | Research Budget | Projected Implementation Timeline |
|---|---|---|
| Blockchain Transaction Platform | $2,100,000 | 24-36 months |
Disclaimer
All information, articles, and product details provided on this website are for general informational and educational purposes only. We do not claim any ownership over, nor do we intend to infringe upon, any trademarks, copyrights, logos, brand names, or other intellectual property mentioned or depicted on this site. Such intellectual property remains the property of its respective owners, and any references here are made solely for identification or informational purposes, without implying any affiliation, endorsement, or partnership.
We make no representations or warranties, express or implied, regarding the accuracy, completeness, or suitability of any content or products presented. Nothing on this website should be construed as legal, tax, investment, financial, medical, or other professional advice. In addition, no part of this site—including articles or product references—constitutes a solicitation, recommendation, endorsement, advertisement, or offer to buy or sell any securities, franchises, or other financial instruments, particularly in jurisdictions where such activity would be unlawful.
All content is of a general nature and may not address the specific circumstances of any individual or entity. It is not a substitute for professional advice or services. Any actions you take based on the information provided here are strictly at your own risk. You accept full responsibility for any decisions or outcomes arising from your use of this website and agree to release us from any liability in connection with your use of, or reliance upon, the content or products found herein.