
|
Renault SA (RNO.PA): BCG Matrix |
Fully Editable: Tailor To Your Needs In Excel Or Sheets
Professional Design: Trusted, Industry-Standard Templates
Investor-Approved Valuation Models
MAC/PC Compatible, Fully Unlocked
No Expertise Is Needed; Easy To Follow
Renault SA (RNO.PA) Bundle
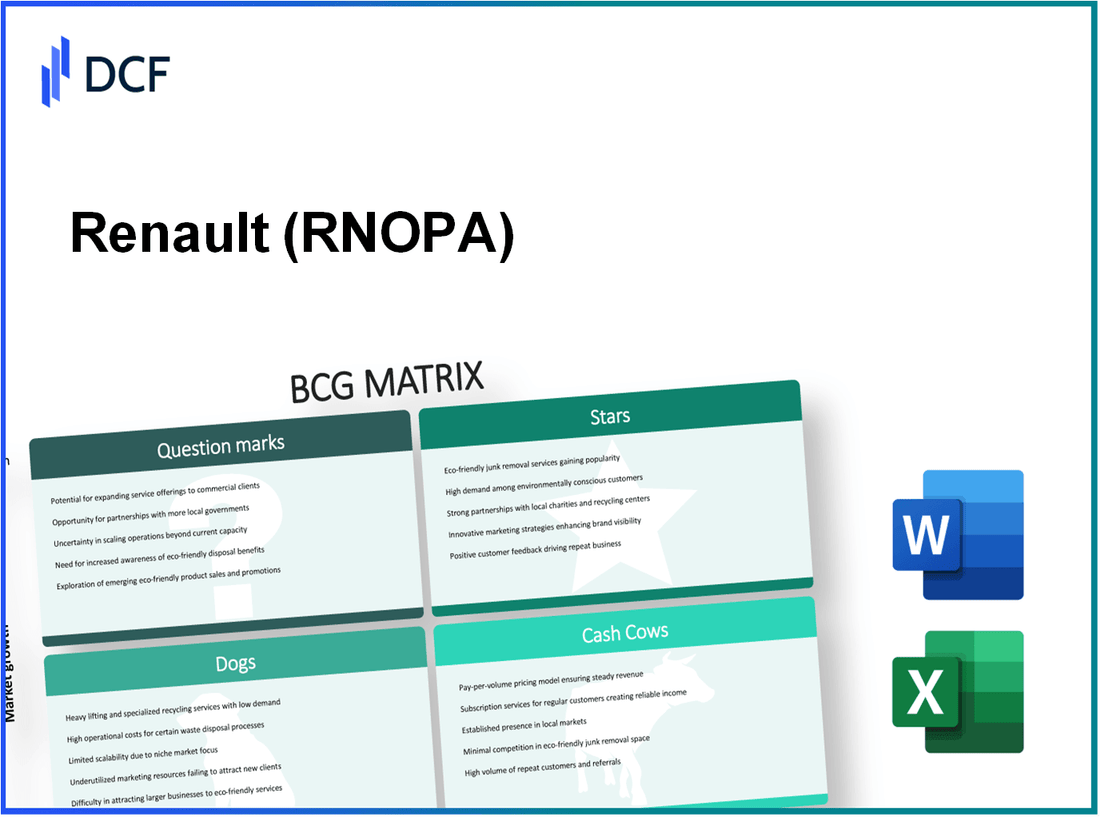
The Boston Consulting Group Matrix offers valuable insights into how Renault SA navigates its competitive landscape, categorizing its business segments into Stars, Cash Cows, Dogs, and Question Marks. By examining these distinct categories, we can uncover what drives Renault's growth and profitability today while also identifying potential risks and opportunities in the fast-evolving automotive market. Dive in to explore how Renault's strategic positioning in electric vehicles, legacy models, and market expansions might shape its future!
Background of Renault SA
Renault SA is a prominent French automotive manufacturer established in 1899. With a mission to innovate and deliver mobility solutions, Renault has positioned itself as a key player in the global automotive market. The company operates under the umbrella of the Renault-Nissan-Mitsubishi Alliance, a strategic partnership that significantly enhances its competitive edge.
In 2022, Renault reported a revenue of approximately €46 billion, reflecting a recovery in the automotive sector post-pandemic. The brand is known for its diverse portfolio, which spans passenger vehicles, commercial vehicles, and electric mobility solutions. Notably, Renault has been investing heavily in electric vehicles (EVs), reinforcing its commitment to sustainability and adaptation to changing consumer preferences.
Renault's production facilities are strategically located across different continents, including Europe, Asia, and South America, allowing the company to cater to a diverse market. In recent years, it has launched several successful models, including the Clio and the Captur, which have gained substantial market traction.
However, the company has faced challenges, particularly concerning supply chain disruptions and the semiconductor shortage that impacted the entire automotive industry. In response, Renault has been focusing on enhancing its operational efficiency and diversifying its supply chain.
As of late 2023, Renault's market capitalization is around €14 billion, a reflection of its significant presence in the automotive sector. The company continues to adapt to the rapidly evolving automotive landscape, particularly in the areas of electrification and autonomous driving technologies.
Renault SA - BCG Matrix: Stars
Renault has positioned itself as a key player in the electric vehicle (EV) segment in Europe, particularly as the market has experienced significant growth. In 2022, the overall EV market in Europe grew by approximately 28%, reaching an estimated 1.1 million units sold. Throughout the first half of 2023, Renault recorded a 20% increase in its electric vehicle sales, resulting in more than 60,000 units sold across the continent.
The Renault ZOE model exemplifies the company's leading position in this segment. In 2022, the ZOE was the best-selling electric car in Europe, with sales surpassing 100,000 units. As of the first half of 2023, Renault reported that the ZOE maintained its popularity, accounting for 15% of the total EV market share in Europe. The average selling price of the ZOE is around €30,000, showcasing a solid revenue generation capability for Renault alongside its growth.
In addition to the ZOE, Renault's investment in autonomous driving technologies further solidifies its star status. In 2023, Renault allocated approximately €1.5 billion towards the development of autonomous driving systems. The company aims to incorporate Level 3 autonomous capabilities in its future vehicles, with plans to launch models equipped with this technology by 2025. This commitment to innovation is reflected in the projected market for autonomous vehicles in Europe, expected to grow to €30 billion by 2030.
| Category | Data |
|---|---|
| EV Market Growth (2022) | 28% |
| EV Sales in Europe (2023) | 1.1 million units |
| Renault EV Sales Increase (H1 2023) | 20% |
| Units Sold (Renault ZOE 2022) | 100,000 units |
| Market Share (Renault ZOE 2023) | 15% |
| Average Selling Price (Renault ZOE) | €30,000 |
| Investments in Autonomous Driving Technologies (2023) | €1.5 billion |
| Projected Autonomous Vehicle Market (EU 2030) | €30 billion |
Renault's strong presence in the electric vehicle market, characterized by its successful ZOE model, and its proactive investments in autonomous driving technology reflect its star status within the BCG Matrix. These elements not only highlight Renault's capabilities but also underscore its potential for future growth and market leadership.
Renault SA - BCG Matrix: Cash Cows
Within the context of Renault SA, several products qualify as cash cows, particularly emphasizing strong market presence in stable sectors. Key examples include the Renault Clio and the range of light commercial vehicles, primarily in the European market.
Renault Clio
The Renault Clio has consistently performed as a cash cow, leading in the subcompact segment. In 2022, Renault sold approximately 227,000 units of the Clio across Europe, maintaining its status as one of the top-selling vehicles in its category. The Clio represents a significant share of Renault's overall sales, contributing to around 18% of the company's total sales volume.
Furthermore, despite a mature market and lower growth projections, the Clio achieves a high profit margin. For 2022, Renault reported an operating margin of approximately 4.5% for the Clio, while its production costs were effectively managed due to established manufacturing processes, sustaining a robust cash flow.
Light Commercial Vehicles
Renault's light commercial vehicles (LCVs), particularly the Renault Master and Renault Trafic, have established themselves as market leaders with significant presence in Europe. In 2023, Renault reported a market share of approximately 15.3% in the European LCV segment. The sales figures for the LCV lineup reached around 142,000 units in 2022.
These vehicles are crucial in generating stable cash flows for Renault, as they cater to businesses needing reliable transport solutions. Operating margins for these LCVs hover around 6.7% due to efficiencies in production and high demand in the commercial sector. Moreover, the capital required for promotion and marketing is minimal, given the established brand presence in this segment.
European Market Operations
Renault's operations in the European market are a significant contributor to the company's cash cow portfolio. The company achieved a total revenue of approximately €40.4 billion in 2022, with the European market accounting for about 68% of total sales. This dominance is further fueled by a solid foundation in both passenger vehicles and commercial offerings.
With declining growth rates projected in the automotive sector, Renault has focused on maintaining its existing market share and maximizing efficiency in European operations. In 2023, the company's investment in infrastructure improvements aimed at enhancing production efficiency is projected at around €750 million over three years.
| Segment | Units Sold (2022) | Market Share (%) | Operating Margin (%) | Revenue (€ billion) | Investment in Infrastructure (€ million) |
|---|---|---|---|---|---|
| Renault Clio | 227,000 | 18 | 4.5 | N/A | N/A |
| Light Commercial Vehicles | 142,000 | 15.3 | 6.7 | N/A | N/A |
| European Market Operations | N/A | 68 | N/A | 40.4 | 750 |
These cash cows not only bolster Renault’s financial standing but also provide necessary funds to invest in growth areas, ultimately reinforcing the company's strategic positioning within the automotive industry.
Renault SA - BCG Matrix: Dogs
Renault’s presence in North America has been notably limited. As of 2023, Renault's market share in the United States was approximately 0.5%. This low figure reflects a long-standing challenge for the company, as it has failed to establish a significant foothold in a highly competitive market dominated by major automakers such as Ford, General Motors, and Toyota.
In 2022, Renault sold just over 5,000 units in the U.S., which represented a 75% decline compared to sales in 2016. The brand's strategy has been to focus on electric vehicles (EVs), but this transition has not yet garnered the expected traction in North America. Consequently, Renault's North American operations can be categorized firmly as a 'Dog' in the BCG Matrix due to their low growth prospects and minimal market share.
Turning to Renault's diesel engine models, the brand has also seen a significant downturn. Following increased scrutiny over diesel emissions and changing regulations in Europe, the sales of diesel models plummeted. In 2022, diesel vehicles accounted for only 13% of Renault's total sales in Europe, down from 39% in 2016. The company reported that total diesel sales dropped to 110,000 units in 2021, reflecting a 20% decline from the previous year. This decline is driven by the industry's pivot towards hybrid and electric vehicles, which have risen sharply in demand.
| Year | Diesel Engine Sales in Europe | Percentage of Total Sales |
|---|---|---|
| 2016 | 400,000 | 39% |
| 2019 | 210,000 | 20% |
| 2021 | 110,000 | 13% |
| 2022 | N/A | N/A |
Furthermore, Renault's non-core subsidiary operations have become significant sources of concern. The company has several investments in joint ventures and other subsidiaries that contribute minimally to overall profitability. For instance, Renault Samsung Motors, which primarily serves the South Korean market, reported a total of 75,000 vehicles sold in 2022. This is a decline of 30% from 2021, indicating that the investment in this subsidiary is not yielding meaningful growth. In fact, Renault has hinted at the possibility of divesting this subsidiary due to its underperformance, which supports the classification of this segment as a 'Dog.'
Additionally, Renault's operations in Morocco, while strong for local consumption, are not expected to expand significantly. With exports averaging around 35,000 vehicles annually to Europe, the operations in Morocco do not show potential for high growth or market share gain amidst increasing competition from Asian manufacturers.
The Dogs in Renault's portfolio illustrate a challenge for the automotive giant. Low market share and minimal growth prospects mean that resources allocated to these areas could be better utilized elsewhere, leading to the conclusion that divestiture or restructuring may be necessary to streamline operations and focus on more profitable ventures.
Renault SA - BCG Matrix: Question Marks
Renault SA is navigating a complex landscape, particularly in its approach to products classified as Question Marks within the BCG Matrix framework. These products show promise in high-growth markets but struggle with low market share, requiring strategic investment and management to unlock their potential.
Renault's Expansion into Asian Markets
Renault has been actively pursuing expansion strategies in Asia, targeting markets like India and China. In 2022, Renault reported a 20% increase in sales volume in India, reflecting growing consumer interest. However, their overall market share in India remained below 5%, indicating significant room for growth. The company aims to increase its market penetration by investing in local partnerships and expanding its dealer network.
New Hybrid Vehicle Development
Renault is also focusing on new hybrid vehicle technologies, which are emerging as a substantial growth area. The company has committed to investing a total of €2 billion in hybrid and electric vehicle development through 2025. As of the end of 2022, Renault held a 2.7% market share in the hybrid vehicle segment in Europe, while the overall market for hybrids grew by 35% year-on-year in the same period.
Despite their innovations, Renault's hybrid sales figures reveal a concerning performance. In Q1 2023, the hybrid models accounted for only 10,500 units sold, representing a market share that is yet not substantial given the potential for growth in this sector.
| Year | Hybrid Vehicle Investment (in € million) | Market Share (%) in Europe | Units Sold |
|---|---|---|---|
| 2021 | 300 | 2.4 | 8,000 |
| 2022 | 500 | 2.7 | 9,000 |
| 2023 (Q1) | 200 | 3.0 | 10,500 |
Emerging Markets in Africa
The African market represents another growth opportunity for Renault, particularly in countries like Morocco and South Africa. Renault reported a sales increase of 15% in Africa in 2022, yet its market share hovered around 6%, which indicates that there is still a long way to go. This region presents both high growth prospects and significant challenges due to competition and economic factors.
In 2023, Renault anticipates investing approximately €500 million to boost its production facilities and local partnerships in Africa. The continent's automotive market is projected to grow by 10% annually, further highlighting the urgency for Renault to capture a larger share of this emerging market.
| Year | Investment in African Market (in € million) | Sales Growth (%) | Market Share (%) |
|---|---|---|---|
| 2021 | 150 | 8 | 5.5 |
| 2022 | 200 | 15 | 6.0 |
| 2023 (Projected) | 500 | 10 | 7.0 |
Renault’s Question Marks are essential to its long-term strategy. However, without significant investment and strategic focus, these areas may falter in achieving their growth potential, potentially transitioning into Dogs if not managed correctly.
In summary, Renault SA’s strategic positioning within the BCG Matrix reveals a dynamic landscape of opportunities and challenges, from the promising electric vehicle segment and iconic Renault ZOE to the struggles in North America and diesel models. By leveraging its strong cash cows like the Clio and light commercial vehicles, while navigating the uncertain waters of emerging markets and hybrid vehicle developments, Renault can chart a path toward sustainable growth and innovation in the automotive industry.
[right_small]Disclaimer
All information, articles, and product details provided on this website are for general informational and educational purposes only. We do not claim any ownership over, nor do we intend to infringe upon, any trademarks, copyrights, logos, brand names, or other intellectual property mentioned or depicted on this site. Such intellectual property remains the property of its respective owners, and any references here are made solely for identification or informational purposes, without implying any affiliation, endorsement, or partnership.
We make no representations or warranties, express or implied, regarding the accuracy, completeness, or suitability of any content or products presented. Nothing on this website should be construed as legal, tax, investment, financial, medical, or other professional advice. In addition, no part of this site—including articles or product references—constitutes a solicitation, recommendation, endorsement, advertisement, or offer to buy or sell any securities, franchises, or other financial instruments, particularly in jurisdictions where such activity would be unlawful.
All content is of a general nature and may not address the specific circumstances of any individual or entity. It is not a substitute for professional advice or services. Any actions you take based on the information provided here are strictly at your own risk. You accept full responsibility for any decisions or outcomes arising from your use of this website and agree to release us from any liability in connection with your use of, or reliance upon, the content or products found herein.