
|
Renault SA (RNO.PA) DCF Valuation |
Fully Editable: Tailor To Your Needs In Excel Or Sheets
Professional Design: Trusted, Industry-Standard Templates
Investor-Approved Valuation Models
MAC/PC Compatible, Fully Unlocked
No Expertise Is Needed; Easy To Follow
Renault SA (RNO.PA) Bundle
Designed for accuracy, our Renault SA (RNOPA) DCF Calculator empowers you to evaluate Renault SA's valuation using actual financial data and offers complete flexibility to modify all essential parameters for improved projections.
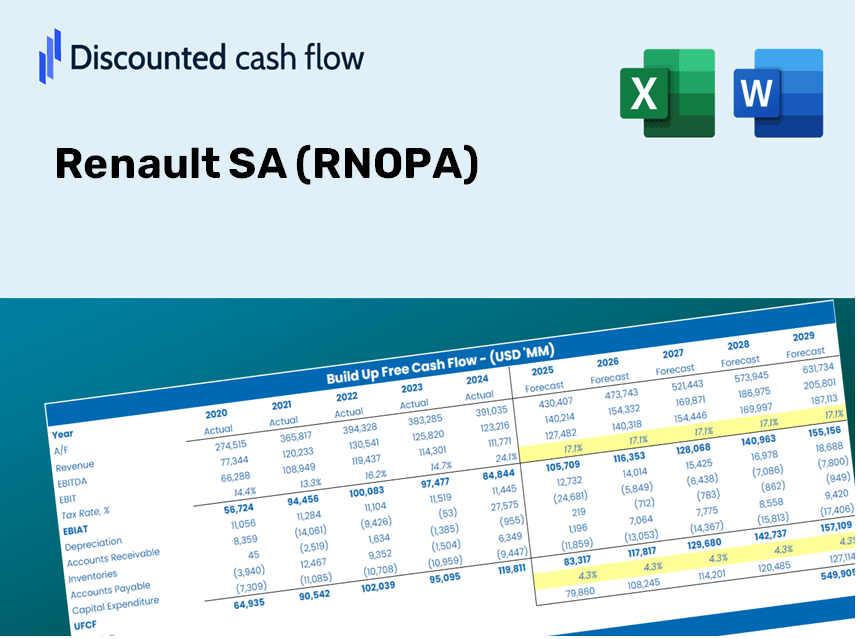
Discounted Cash Flow (DCF) - (USD MM)
| Year | AY1 2020 |
AY2 2021 |
AY3 2022 |
AY4 2023 |
AY5 2024 |
FY1 2025 |
FY2 2026 |
FY3 2027 |
FY4 2028 |
FY5 2029 |
|---|---|---|---|---|---|---|---|---|---|---|
| Revenue | 43,474.0 | 41,659.0 | 46,328.0 | 52,376.0 | 56,232.0 | 60,090.9 | 64,214.6 | 68,621.2 | 73,330.3 | 78,362.5 |
| Revenue Growth, % | 0 | -4.17 | 11.21 | 13.05 | 7.36 | 6.86 | 6.86 | 6.86 | 6.86 | 6.86 |
| EBITDA | 1,861.0 | 4,802.0 | 7,594.0 | 4,968.0 | 5,256.0 | 6,133.1 | 6,554.0 | 7,003.7 | 7,484.3 | 7,997.9 |
| EBITDA, % | 4.28 | 11.53 | 16.39 | 9.49 | 9.35 | 10.21 | 10.21 | 10.21 | 10.21 | 10.21 |
| Depreciation | 3,987.0 | 3,896.0 | 5,540.0 | 2,684.0 | 2,861.0 | 4,890.6 | 5,226.3 | 5,584.9 | 5,968.2 | 6,377.7 |
| Depreciation, % | 9.17 | 9.35 | 11.96 | 5.12 | 5.09 | 8.14 | 8.14 | 8.14 | 8.14 | 8.14 |
| EBIT | -2,126.0 | 906.0 | 2,054.0 | 2,284.0 | 2,395.0 | 4,687.1 | 5,008.7 | 5,352.5 | 5,719.8 | 6,112.3 |
| EBIT, % | -4.89 | 2.17 | 4.43 | 4.36 | 4.26 | 7.8 | 7.8 | 7.8 | 7.8 | 7.8 |
| Total Cash | 22,123.0 | 22,821.0 | 22,361.0 | 21,177.0 | 23,075.0 | 28,291.2 | 30,232.6 | 32,307.3 | 34,524.4 | 36,893.6 |
| Total Cash, percent | .0 | .0 | .0 | .0 | .0 | .0 | .0 | .0 | .0 | .0 |
| Account Receivables | 25,088.0 | 43,554.0 | 48,554.0 | 54,829.0 | 59,959.0 | 55,008.2 | 58,783.0 | 62,817.0 | 67,127.7 | 71,734.3 |
| Account Receivables, % | 57.71 | 104.55 | 104.8 | 104.68 | 106.63 | 91.54 | 91.54 | 91.54 | 91.54 | 91.54 |
| Inventories | 5,640.0 | 4,792.0 | 5,213.0 | 4,924.0 | 5,468.0 | 6,592.4 | 7,044.8 | 7,528.3 | 8,044.9 | 8,597.0 |
| Inventories, % | 12.97 | 11.5 | 11.25 | 9.4 | 9.72 | 10.97 | 10.97 | 10.97 | 10.97 | 10.97 |
| Accounts Payable | 8,277.0 | 7,975.0 | 8,405.0 | 7,965.0 | 9,809.0 | 10,693.3 | 11,427.1 | 12,211.3 | 13,049.3 | 13,944.8 |
| Accounts Payable, % | 19.04 | 19.14 | 18.14 | 15.21 | 17.44 | 17.8 | 17.8 | 17.8 | 17.8 | 17.8 |
| Capital Expenditure | -4,208.0 | -2,686.0 | -2,684.0 | -3,064.0 | -3,050.0 | -3,989.4 | -4,263.1 | -4,555.7 | -4,868.3 | -5,202.4 |
| Capital Expenditure, % | -9.68 | -6.45 | -5.79 | -5.85 | -5.42 | -6.64 | -6.64 | -6.64 | -6.64 | -6.64 |
| Tax Rate, % | 51.11 | 51.11 | 51.11 | 51.11 | 51.11 | 51.11 | 51.11 | 51.11 | 51.11 | 51.11 |
| EBITAT | -2,232.5 | 718.3 | -341.7 | 1,768.9 | 1,171.0 | 2,865.0 | 3,061.6 | 3,271.7 | 3,496.3 | 3,736.2 |
| Depreciation | ||||||||||
| Changes in Account Receivables | ||||||||||
| Changes in Inventories | ||||||||||
| Changes in Accounts Payable | ||||||||||
| Capital Expenditure | ||||||||||
| UFCF | -24,904.5 | -15,991.7 | -2,476.7 | -5,037.1 | -2,848.0 | 8,477.0 | 531.3 | 567.8 | 606.7 | 648.3 |
| WACC, % | 4.24 | 3.56 | 0.95216 | 3.5 | 2.56 | 2.96 | 2.96 | 2.96 | 2.96 | 2.96 |
| PV UFCF | ||||||||||
| SUM PV UFCF | 10,354.7 | |||||||||
| Long Term Growth Rate, % | 2.00 | |||||||||
| Free cash flow (T + 1) | 661 | |||||||||
| Terminal Value | 68,803 | |||||||||
| Present Terminal Value | 59,462 | |||||||||
| Enterprise Value | 69,816 | |||||||||
| Net Debt | 49,148 | |||||||||
| Equity Value | 20,668 | |||||||||
| Diluted Shares Outstanding, MM | 277 | |||||||||
| Equity Value Per Share | 74.65 |
What You Will Receive
- Authentic RNOPA Financials: Provides both historical and projected data for precise valuation.
- Customizable Inputs: Adjust WACC, tax rates, revenue growth, and capital expenditures as needed.
- Automatic Calculations: Intrinsic value and NPV are computed in real-time.
- Scenario Analysis: Explore various scenarios to assess Renault’s future performance.
- User-Friendly Design: Designed for professionals while remaining easy for newcomers to navigate.
Highlighted Features
- Customizable Forecast Inputs: Adjust key metrics such as sales growth, EBITDA margin, and capital investment.
- Instant DCF Valuation: Automatically computes intrinsic value, NPV, and additional financial outputs.
- Top-Tier Accuracy: Leverages Renault SA’s (RNOPA) actual financial data for credible valuation results.
- Simplified Scenario Analysis: Effortlessly assess various assumptions and view comparative results.
- Efficiency Booster: Removes the need for crafting intricate valuation models from the ground up.
Understanding Our Process
- 1. Access the Template: Download and open the Excel file featuring Renault SA (RNOPA)'s preloaded data.
- 2. Adjust Assumptions: Modify essential inputs such as growth rates, WACC, and capital expenditures to fit your analysis.
- 3. Observe Results Immediately: The DCF model automatically computes intrinsic value and NPV based on your inputs.
- 4. Explore Different Scenarios: Evaluate various forecasts to understand the potential valuation outcomes for Renault SA (RNOPA).
- 5. Present with Confidence: Share professional valuation insights to enhance your decision-making process.
Why Choose This Calculator for Renault SA (RNOPA)?
- Accuracy: Utilizes genuine Renault financial data for precise results.
- Flexibility: Allows users to easily experiment and adjust inputs as needed.
- Time-Saving: Eliminate the complexities of constructing a DCF model from the ground up.
- Professional-Grade: Crafted with the expertise and attention to detail expected at the CFO level.
- User-Friendly: Intuitive interface suitable for users without extensive financial modeling knowledge.
Who Can Benefit from This Product?
- Institutional Investors: Develop comprehensive and accurate valuation models for analyzing their Renault SA (RNOPA) portfolio.
- Finance Departments: Evaluate various valuation scenarios to inform corporate strategy for Renault SA (RNOPA).
- Consultants and Investment Advisors: Deliver precise valuation insights to clients regarding Renault SA (RNOPA) stock.
- Students and Educators: Apply real market data to enhance learning and practice in financial modeling.
- Automotive Industry Enthusiasts: Gain insights into how automotive companies like Renault SA (RNOPA) are valued in the financial landscape.
Contents of the Template
- Operating and Balance Sheet Data: Pre-filled historical data and forecasts for Renault SA (RNOPA), including revenue, EBITDA, EBIT, and capital expenditures.
- WACC Calculation: A dedicated sheet for the Weighted Average Cost of Capital (WACC), featuring parameters such as Beta, risk-free rate, and share price.
- DCF Valuation (Unlevered and Levered): Customizable Discounted Cash Flow models that illustrate intrinsic value, complete with detailed calculations.
- Financial Statements: Pre-loaded annual and quarterly financial statements to facilitate thorough analysis.
- Key Ratios: Includes profitability, leverage, and efficiency ratios relevant to Renault SA (RNOPA).
- Dashboard and Charts: A visual summary of valuation outputs and assumptions to simplify the analysis of results.
Disclaimer
All information, articles, and product details provided on this website are for general informational and educational purposes only. We do not claim any ownership over, nor do we intend to infringe upon, any trademarks, copyrights, logos, brand names, or other intellectual property mentioned or depicted on this site. Such intellectual property remains the property of its respective owners, and any references here are made solely for identification or informational purposes, without implying any affiliation, endorsement, or partnership.
We make no representations or warranties, express or implied, regarding the accuracy, completeness, or suitability of any content or products presented. Nothing on this website should be construed as legal, tax, investment, financial, medical, or other professional advice. In addition, no part of this site—including articles or product references—constitutes a solicitation, recommendation, endorsement, advertisement, or offer to buy or sell any securities, franchises, or other financial instruments, particularly in jurisdictions where such activity would be unlawful.
All content is of a general nature and may not address the specific circumstances of any individual or entity. It is not a substitute for professional advice or services. Any actions you take based on the information provided here are strictly at your own risk. You accept full responsibility for any decisions or outcomes arising from your use of this website and agree to release us from any liability in connection with your use of, or reliance upon, the content or products found herein.