
|
Deliveroo plc (ROO.L) DCF Valuation |
Fully Editable: Tailor To Your Needs In Excel Or Sheets
Professional Design: Trusted, Industry-Standard Templates
Investor-Approved Valuation Models
MAC/PC Compatible, Fully Unlocked
No Expertise Is Needed; Easy To Follow
Deliveroo plc (ROO.L) Bundle
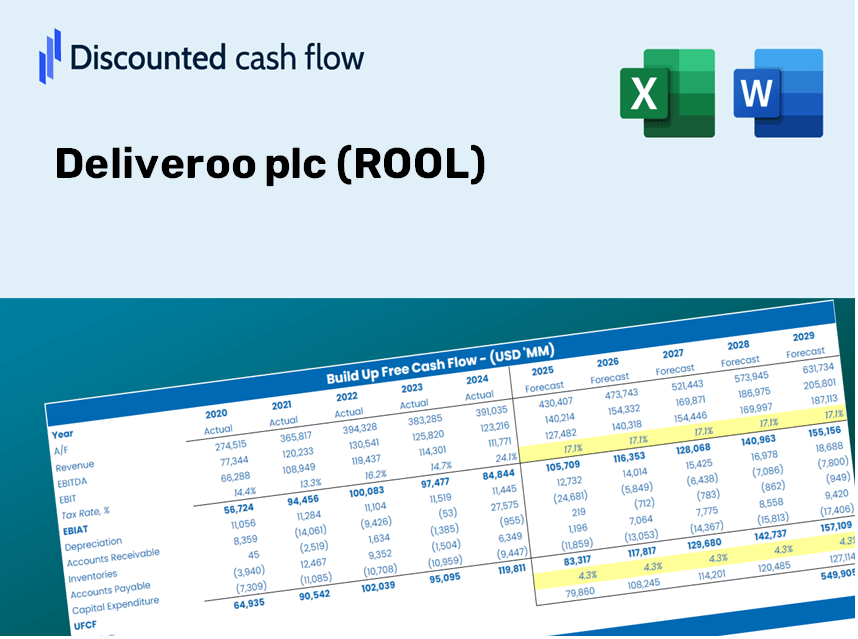
Gain insights into your Deliveroo plc (ROOL) valuation analysis using our cutting-edge DCF Calculator! Equipped with real (ROOL) data, this Excel template lets you adjust forecasts and assumptions to accurately determine the intrinsic value of Deliveroo plc (ROOL).
Discounted Cash Flow (DCF) - (USD MM)
| Year | AY1 2020 |
AY2 2021 |
AY3 2022 |
AY4 2023 |
AY5 2024 |
FY1 2025 |
FY2 2026 |
FY3 2027 |
FY4 2028 |
FY5 2029 |
|---|---|---|---|---|---|---|---|---|---|---|
| Revenue | 1,190.8 | 1,735.0 | 1,974.7 | 2,030.0 | 2,071.9 | 2,405.4 | 2,792.5 | 3,242.0 | 3,763.8 | 4,369.6 |
| Revenue Growth, % | 0 | 45.7 | 13.82 | 2.8 | 2.06 | 16.1 | 16.1 | 16.1 | 16.1 | 16.1 |
| EBITDA | -176.9 | -237.4 | -166.0 | 65.5 | 86.1 | -142.2 | -165.1 | -191.7 | -222.5 | -258.4 |
| EBITDA, % | -14.86 | -13.68 | -8.41 | 3.23 | 4.16 | -5.91 | -5.91 | -5.91 | -5.91 | -5.91 |
| Depreciation | 35.1 | 43.3 | 61.8 | 73.9 | 71.7 | 75.4 | 87.5 | 101.6 | 118.0 | 137.0 |
| Depreciation, % | 2.95 | 2.5 | 3.13 | 3.64 | 3.46 | 3.13 | 3.13 | 3.13 | 3.13 | 3.13 |
| EBIT | -212.0 | -280.7 | -227.8 | -8.4 | 14.4 | -217.6 | -252.6 | -293.3 | -340.5 | -395.3 |
| EBIT, % | -17.8 | -16.18 | -11.54 | -0.41379 | 0.69501 | -9.05 | -9.05 | -9.05 | -9.05 | -9.05 |
| Total Cash | 379.1 | 1,290.9 | 999.6 | 678.8 | 667.9 | 1,070.6 | 1,242.9 | 1,442.9 | 1,675.1 | 1,944.8 |
| Total Cash, percent | .0 | .0 | .0 | .0 | .0 | .0 | .0 | .0 | .0 | .0 |
| Account Receivables | 66.8 | 72.7 | 89.0 | 120.3 | 75.9 | 115.0 | 133.5 | 154.9 | 179.9 | 208.8 |
| Account Receivables, % | 5.61 | 4.19 | 4.51 | 5.93 | 3.66 | 4.78 | 4.78 | 4.78 | 4.78 | 4.78 |
| Inventories | 8.2 | 18.2 | 19.4 | 14.8 | 13.3 | 19.7 | 22.8 | 26.5 | 30.8 | 35.8 |
| Inventories, % | 0.68861 | 1.05 | 0.98243 | 0.72906 | 0.64192 | 0.8182 | 0.8182 | 0.8182 | 0.8182 | 0.8182 |
| Accounts Payable | 22.9 | 25.2 | 25.7 | 16.0 | 146.0 | 60.2 | 69.9 | 81.1 | 94.2 | 109.3 |
| Accounts Payable, % | 1.92 | 1.45 | 1.3 | 0.78818 | 7.05 | 2.5 | 2.5 | 2.5 | 2.5 | 2.5 |
| Capital Expenditure | -26.3 | -56.0 | -80.4 | -43.7 | -44.7 | -66.5 | -77.2 | -89.6 | -104.0 | -120.8 |
| Capital Expenditure, % | -2.21 | -3.23 | -4.07 | -2.15 | -2.16 | -2.76 | -2.76 | -2.76 | -2.76 | -2.76 |
| Tax Rate, % | 76.23 | 76.23 | 76.23 | 76.23 | 76.23 | 76.23 | 76.23 | 76.23 | 76.23 | 76.23 |
| EBITAT | -225.8 | -329.2 | -290.5 | -24.5 | 3.4 | -184.4 | -214.1 | -248.6 | -288.6 | -335.1 |
| Depreciation | ||||||||||
| Changes in Account Receivables | ||||||||||
| Changes in Inventories | ||||||||||
| Changes in Accounts Payable | ||||||||||
| Capital Expenditure | ||||||||||
| UFCF | -269.1 | -355.5 | -326.1 | -30.7 | 206.3 | -306.8 | -215.7 | -250.5 | -290.8 | -337.6 |
| WACC, % | 6.48 | 6.48 | 6.48 | 6.48 | 6.38 | 6.46 | 6.46 | 6.46 | 6.46 | 6.46 |
| PV UFCF | ||||||||||
| SUM PV UFCF | -1,159.4 | |||||||||
| Long Term Growth Rate, % | 2.00 | |||||||||
| Free cash flow (T + 1) | -344 | |||||||||
| Terminal Value | -7,726 | |||||||||
| Present Terminal Value | -5,651 | |||||||||
| Enterprise Value | -6,810 | |||||||||
| Net Debt | -411 | |||||||||
| Equity Value | -6,399 | |||||||||
| Diluted Shares Outstanding, MM | 1,618 | |||||||||
| Equity Value Per Share | -395.60 |
What You Will Receive
- Pre-Filled Financial Model: Deliveroo’s actual data provides an accurate DCF valuation.
- Comprehensive Forecast Control: Modify revenue growth, profit margins, WACC, and other critical drivers.
- Immediate Calculations: Automatic updates offer real-time results as you adjust inputs.
- Investor-Ready Template: A polished Excel model crafted for professional-level valuation.
- Customizable and Reusable: Designed for versatility, enabling repeated use for in-depth forecasts.
Key Features
- 🔍 Real-Life Deliveroo Financials: Pre-filled historical and projected data for Deliveroo plc (ROOL).
- ✏️ Fully Customizable Inputs: Adjust all critical parameters (yellow cells) such as WACC, growth %, and tax rates.
- 📊 Professional DCF Valuation: Integrated formulas to determine Deliveroo's intrinsic value utilizing the Discounted Cash Flow method.
- ⚡ Instant Results: Visualize Deliveroo's valuation immediately upon making adjustments.
- Scenario Analysis: Evaluate and compare outcomes based on varying financial assumptions side-by-side.
How It Works
- Step 1: Download the Excel file for Deliveroo plc (ROOL).
- Step 2: Review the pre-filled financial data and forecasts for Deliveroo.
- Step 3: Adjust key inputs such as revenue growth, WACC, and tax rates (highlighted cells).
- Step 4: Observe the DCF model update in real-time as you modify your assumptions.
- Step 5: Analyze the output and leverage the results for your investment strategies.
Why Choose Deliveroo's Financial Calculator?
- Time-Saving: Skip the hassle of building a DCF model from the ground up – it’s ready for immediate use.
- Enhanced Accuracy: Dependable financial data and established formulas help minimize valuation errors.
- Completely Customizable: Adjust the model to align with your specific assumptions and forecasts.
- User-Friendly: Intuitive charts and outputs simplify the analysis of results.
- Preferred by Professionals: Crafted for experts who prioritize both accuracy and ease of use.
Who Should Use This Product?
- Individual Investors: Make informed choices about buying or selling Deliveroo plc (ROOL) shares.
- Financial Analysts: Enhance valuation efforts with accessible financial models tailored for Deliveroo plc (ROOL).
- Consultants: Provide clients with swift and precise valuation insights on Deliveroo plc (ROOL).
- Business Owners: Gain insights into the valuation of major companies like Deliveroo plc (ROOL) to inform your strategic decisions.
- Finance Students: Acquire practical valuation skills using the data and scenarios from Deliveroo plc (ROOL).
Contents of the Template
- Preloaded ROOL Data: Historical and projected financial metrics, including revenue, EBIT, and capital expenditures.
- DCF and WACC Models: Professional-grade spreadsheets for calculating intrinsic value and the Weighted Average Cost of Capital.
- Editable Inputs: Yellow-highlighted cells for modifying revenue growth rates, tax percentages, and discount rates.
- Financial Statements: Detailed annual and quarterly financial reports for in-depth analysis.
- Key Ratios: Metrics on profitability, leverage, and efficiency for performance assessment.
- Dashboard and Charts: Visual representations of valuation results and underlying assumptions.
Disclaimer
All information, articles, and product details provided on this website are for general informational and educational purposes only. We do not claim any ownership over, nor do we intend to infringe upon, any trademarks, copyrights, logos, brand names, or other intellectual property mentioned or depicted on this site. Such intellectual property remains the property of its respective owners, and any references here are made solely for identification or informational purposes, without implying any affiliation, endorsement, or partnership.
We make no representations or warranties, express or implied, regarding the accuracy, completeness, or suitability of any content or products presented. Nothing on this website should be construed as legal, tax, investment, financial, medical, or other professional advice. In addition, no part of this site—including articles or product references—constitutes a solicitation, recommendation, endorsement, advertisement, or offer to buy or sell any securities, franchises, or other financial instruments, particularly in jurisdictions where such activity would be unlawful.
All content is of a general nature and may not address the specific circumstances of any individual or entity. It is not a substitute for professional advice or services. Any actions you take based on the information provided here are strictly at your own risk. You accept full responsibility for any decisions or outcomes arising from your use of this website and agree to release us from any liability in connection with your use of, or reliance upon, the content or products found herein.