
|
RS Group plc (RS1.L) DCF Valuation |
Fully Editable: Tailor To Your Needs In Excel Or Sheets
Professional Design: Trusted, Industry-Standard Templates
Investor-Approved Valuation Models
MAC/PC Compatible, Fully Unlocked
No Expertise Is Needed; Easy To Follow
RS Group plc (RS1.L) Bundle
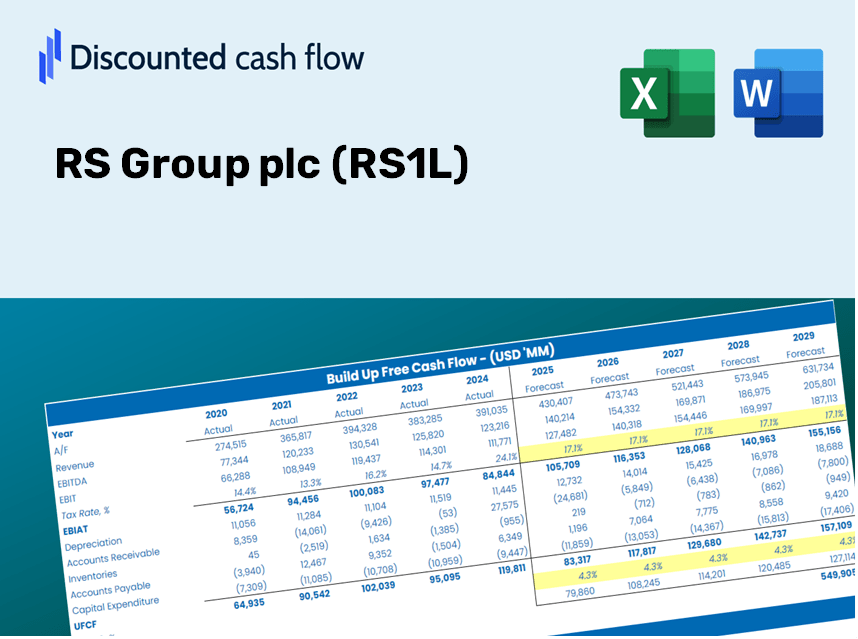
Simplify RS Group plc (RS1L) valuation with this customizable DCF Calculator! Featuring real RS Group plc (RS1L) financials and adjustable forecast inputs, you can test scenarios and uncover RS Group plc (RS1L) fair value in minutes.
Discounted Cash Flow (DCF) - (USD MM)
| Year | AY1 2021 |
AY2 2022 |
AY3 2023 |
AY4 2024 |
AY5 2025 |
FY1 2026 |
FY2 2027 |
FY3 2028 |
FY4 2029 |
FY5 2030 |
|---|---|---|---|---|---|---|---|---|---|---|
| Revenue | 2,002.7 | 2,553.7 | 2,982.3 | 2,942.4 | 2,903.5 | 3,205.7 | 3,539.4 | 3,907.8 | 4,314.6 | 4,763.7 |
| Revenue Growth, % | 0 | 27.51 | 16.78 | -1.34 | -1.32 | 10.41 | 10.41 | 10.41 | 10.41 | 10.41 |
| EBITDA | 240.3 | 379.8 | 447.6 | 364.8 | 320.2 | 418.7 | 462.3 | 510.4 | 563.5 | 622.2 |
| EBITDA, % | 12 | 14.87 | 15.01 | 12.4 | 11.03 | 13.06 | 13.06 | 13.06 | 13.06 | 13.06 |
| Depreciation | 56.5 | 63.7 | 64.6 | 83.7 | 85.4 | 85.1 | 93.9 | 103.7 | 114.5 | 126.4 |
| Depreciation, % | 2.82 | 2.49 | 2.17 | 2.84 | 2.94 | 2.65 | 2.65 | 2.65 | 2.65 | 2.65 |
| EBIT | 183.8 | 316.1 | 383.0 | 281.1 | 234.8 | 333.6 | 368.4 | 406.7 | 449.1 | 495.8 |
| EBIT, % | 9.18 | 12.38 | 12.84 | 9.55 | 8.09 | 10.41 | 10.41 | 10.41 | 10.41 | 10.41 |
| Total Cash | 197.9 | 257.9 | 260.3 | 258.7 | 147.7 | 273.1 | 301.5 | 332.9 | 367.5 | 405.8 |
| Total Cash, percent | .0 | .0 | .0 | .0 | .0 | .0 | .0 | .0 | .0 | .0 |
| Account Receivables | 490.0 | 578.9 | 675.8 | 649.7 | 635.2 | 729.3 | 805.2 | 889.1 | 981.6 | 1,083.8 |
| Account Receivables, % | 24.47 | 22.67 | 22.66 | 22.08 | 21.88 | 22.75 | 22.75 | 22.75 | 22.75 | 22.75 |
| Inventories | 419.8 | 529.5 | 616.3 | 656.0 | 617.3 | 679.1 | 749.8 | 827.8 | 914.0 | 1,009.1 |
| Inventories, % | 20.96 | 20.73 | 20.67 | 22.29 | 21.26 | 21.18 | 21.18 | 21.18 | 21.18 | 21.18 |
| Accounts Payable | 319.4 | 377.3 | 398.5 | 381.8 | 359.4 | 445.2 | 491.5 | 542.7 | 599.2 | 661.6 |
| Accounts Payable, % | 15.95 | 14.77 | 13.36 | 12.98 | 12.38 | 13.89 | 13.89 | 13.89 | 13.89 | 13.89 |
| Capital Expenditure | -54.7 | -42.5 | -46.1 | -51.6 | -49.3 | -60.2 | -66.5 | -73.4 | -81.1 | -89.5 |
| Capital Expenditure, % | -2.73 | -1.66 | -1.55 | -1.75 | -1.7 | -1.88 | -1.88 | -1.88 | -1.88 | -1.88 |
| Tax Rate, % | 25.96 | 25.96 | 25.96 | 25.96 | 25.96 | 25.96 | 25.96 | 25.96 | 25.96 | 25.96 |
| EBITAT | 143.8 | 241.0 | 294.2 | 207.5 | 173.8 | 253.0 | 279.3 | 308.4 | 340.5 | 376.0 |
| Depreciation | ||||||||||
| Changes in Account Receivables | ||||||||||
| Changes in Inventories | ||||||||||
| Changes in Accounts Payable | ||||||||||
| Capital Expenditure | ||||||||||
| UFCF | -444.8 | 121.5 | 150.2 | 209.3 | 240.7 | 207.7 | 206.5 | 228.0 | 251.7 | 277.9 |
| WACC, % | 6.62 | 6.6 | 6.6 | 6.57 | 6.57 | 6.59 | 6.59 | 6.59 | 6.59 | 6.59 |
| PV UFCF | ||||||||||
| SUM PV UFCF | 961.9 | |||||||||
| Long Term Growth Rate, % | 3.00 | |||||||||
| Free cash flow (T + 1) | 286 | |||||||||
| Terminal Value | 7,971 | |||||||||
| Present Terminal Value | 5,793 | |||||||||
| Enterprise Value | 6,755 | |||||||||
| Net Debt | 364 | |||||||||
| Equity Value | 6,391 | |||||||||
| Diluted Shares Outstanding, MM | 470 | |||||||||
| Equity Value Per Share | 1,359.10 |
What You Will Receive
- Authentic RS1L Financial Data: Pre-loaded with RS Group plc's historical and future financial information for accurate analysis.
- Completely Customizable Template: Easily adjust essential inputs like revenue growth, WACC, and EBITDA percentage.
- Instant Calculations: Watch the intrinsic value of RS Group plc update in real-time as you make changes.
- Professional Valuation Tool: Tailored for investors, analysts, and consultants who require precise DCF results.
- User-Centric Design: Streamlined layout and straightforward instructions suitable for all skill levels.
Key Features
- 🔍 Real-Life RS Group Financials: Pre-filled historical and projected data for RS Group plc (RS1L).
- ✏️ Fully Customizable Inputs: Adjust all critical parameters (yellow cells) such as WACC, growth %, and tax rates.
- 📊 Professional DCF Valuation: Built-in formulas calculate RS Group's intrinsic value using the Discounted Cash Flow method.
- ⚡ Instant Results: Visualize RS Group's valuation instantly after making adjustments.
- Scenario Analysis: Test and compare outcomes for various financial assumptions side-by-side.
How It Functions
- Download the Template: Gain immediate access to the Excel-based RS Group plc (RS1L) DCF Calculator.
- Input Your Assumptions: Modify the yellow-highlighted cells for growth rates, WACC, profit margins, and additional parameters.
- Instant Calculations: The model automatically recalculates RS Group plc’s intrinsic value.
- Test Scenarios: Experiment with various assumptions to assess potential valuation shifts.
- Analyze and Decide: Utilize the results to inform your investment or financial decision-making.
Why Choose This Calculator for RS Group plc (RS1L)?
- User-Friendly Interface: Perfectly crafted for both novices and seasoned professionals.
- Customizable Inputs: Effortlessly adjust parameters to tailor your analysis.
- Real-Time Updates: Observe immediate changes in RS Group plc’s valuation as you modify inputs.
- Pre-Configured Data: Comes equipped with RS Group plc’s actual financial metrics for swift analysis.
- Endorsed by Experts: Widely utilized by investors and analysts for making sound financial decisions.
Who Is This Product Designed For?
- Investors: Accurately assess RS Group plc’s (RS1L) fair value to inform your investment choices.
- CFOs: Utilize a professional-grade DCF model for enhanced financial reporting and analysis.
- Consultants: Effortlessly customize the template for client valuation reports.
- Entrepreneurs: Discover financial modeling insights utilized by leading corporations.
- Educators: Implement it as a teaching resource to illustrate valuation techniques.
Components of the Template
- Pre-Filled DCF Model: RS Group plc’s financial data preloaded for immediate application.
- WACC Calculator: Comprehensive calculations for the Weighted Average Cost of Capital.
- Financial Ratios: Assess RS Group plc’s profitability, leverage, and operational efficiency.
- Editable Inputs: Modify assumptions like growth rates, margins, and capital expenditures to suit your scenarios.
- Financial Statements: Annual and quarterly reports to facilitate in-depth analysis.
- Interactive Dashboard: Effortlessly visualize essential valuation metrics and outcomes.
Disclaimer
All information, articles, and product details provided on this website are for general informational and educational purposes only. We do not claim any ownership over, nor do we intend to infringe upon, any trademarks, copyrights, logos, brand names, or other intellectual property mentioned or depicted on this site. Such intellectual property remains the property of its respective owners, and any references here are made solely for identification or informational purposes, without implying any affiliation, endorsement, or partnership.
We make no representations or warranties, express or implied, regarding the accuracy, completeness, or suitability of any content or products presented. Nothing on this website should be construed as legal, tax, investment, financial, medical, or other professional advice. In addition, no part of this site—including articles or product references—constitutes a solicitation, recommendation, endorsement, advertisement, or offer to buy or sell any securities, franchises, or other financial instruments, particularly in jurisdictions where such activity would be unlawful.
All content is of a general nature and may not address the specific circumstances of any individual or entity. It is not a substitute for professional advice or services. Any actions you take based on the information provided here are strictly at your own risk. You accept full responsibility for any decisions or outcomes arising from your use of this website and agree to release us from any liability in connection with your use of, or reliance upon, the content or products found herein.