
|
RS Group plc (RS1.L): SWOT Analysis |
Fully Editable: Tailor To Your Needs In Excel Or Sheets
Professional Design: Trusted, Industry-Standard Templates
Investor-Approved Valuation Models
MAC/PC Compatible, Fully Unlocked
No Expertise Is Needed; Easy To Follow
RS Group plc (RS1.L) Bundle
The ever-evolving landscape of business demands a keen understanding of competitive positioning, and RS Group plc exemplifies this necessity through its comprehensive SWOT analysis. By dissecting strengths, weaknesses, opportunities, and threats, we unveil the dynamic forces shaping RS Group's strategic direction. Dive in to explore how this framework not only highlights the company's robust advantages but also pinpoints critical areas for growth and adaptation in a competitive market.
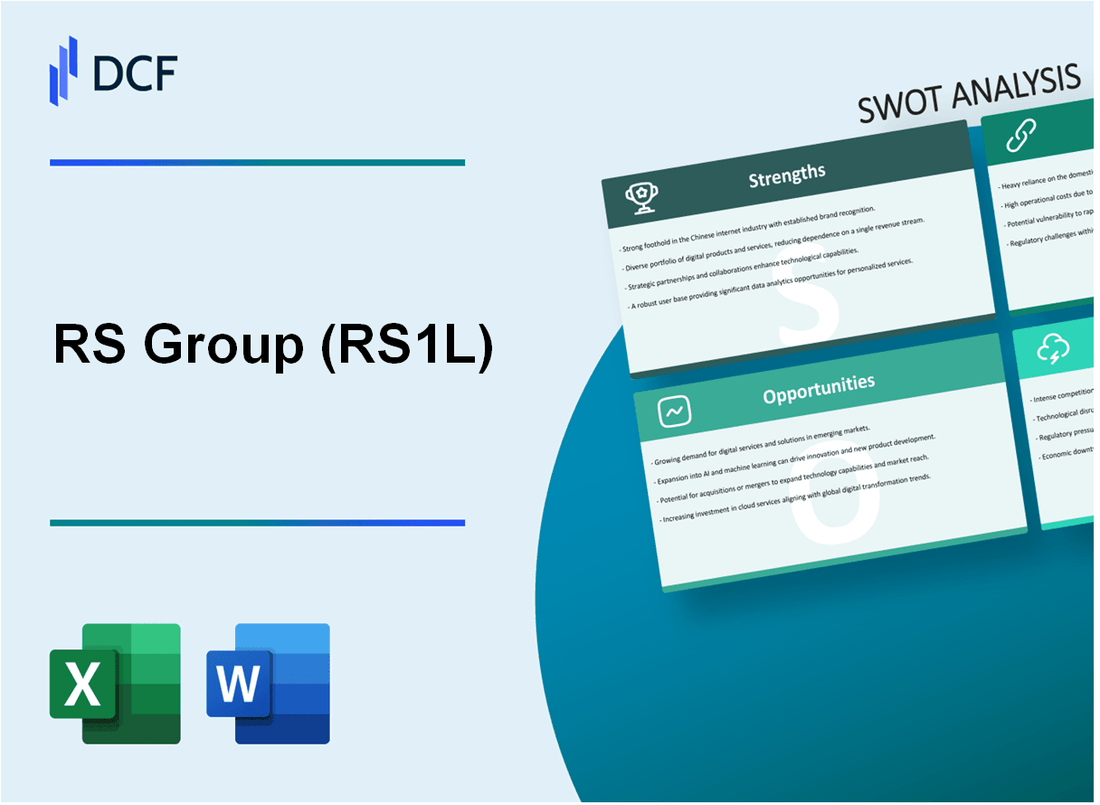
RS Group plc - SWOT Analysis: Strengths
Diverse product range catering to multiple industries: RS Group plc offers a comprehensive portfolio of over 600,000 products, ranging from electrical components to automation and control products. This extensive variety caters to sectors including manufacturing, construction, and telecommunications, enabling RS Group to serve a wide array of customers across different industries and geographic regions.
Strong global distribution network: RS Group operates in more than 80 countries, with a network of warehouses and distribution centers strategically placed to optimize delivery efficiency. Their logistics capabilities are impressive, reflected by their ability to deliver in next day service to most locations in Europe. The company has implemented advanced technology in its distribution centers, enhancing order processing speed and accuracy.
Established brand reputation and customer loyalty: RS Group has built a strong brand that is synonymous with quality and reliability. Their emphasis on customer satisfaction has led to a 90% repeat order rate among its customers, showcasing a high level of customer loyalty. The company’s positive reputation is further endorsed by numerous industry awards, highlighting its commitment to excellence.
Robust financial performance and cash flow stability: For the fiscal year ending March 2023, RS Group reported revenues of £2.1 billion, a growth of 13% year-over-year. The company also achieved a profit before tax of £370 million, indicating a strong bottom line. Their cash flow has remained stable, with operating cash flow of approximately £300 million, enabling reinvestment and shareholder returns.
| Financial Metric | FY 2023 | FY 2022 | Change (%) |
|---|---|---|---|
| Revenue | £2.1 billion | £1.85 billion | +13% |
| Profit Before Tax | £370 million | £330 million | +12% |
| Operating Cash Flow | £300 million | £280 million | +7% |
Effective supply chain management: RS Group has implemented a sophisticated supply chain management system that emphasizes efficiency and responsiveness. The company's inventory turnover ratio was reported at 6.5 times for FY 2023, indicating a strong ability to manage stock levels effectively while meeting customer demands. Furthermore, partnerships with key suppliers have strengthened relationships and ensured product availability, enhancing the overall supply chain resilience.
RS Group plc - SWOT Analysis: Weaknesses
RS Group plc faces several weaknesses that could impact its operational efficiency and market competitiveness.
Dependence on Third-Party Suppliers for Inventory
RS Group relies heavily on third-party suppliers for its inventory management. As of the latest financial reports, approximately 65% of its inventory is sourced externally. This dependence can lead to supply chain disruptions, particularly in times of geopolitical instability or natural disasters. For example, disruptions during the COVID-19 pandemic highlighted vulnerabilities in reliance on suppliers, affecting product availability and customer satisfaction.
High Operational Costs in Certain Regions
The company has reported high operational costs, particularly in regions such as North America and Europe. In the FY 2023, operational costs surged to approximately £250 million, influenced by factors such as logistics, labor costs, and compliance with local regulations. These elevated costs can squeeze profit margins, especially in highly competitive markets.
Potential Vulnerability to Currency Fluctuations
RS Group operates internationally, exposing it to currency risks. In FY 2023, the company reported that 30% of its revenue is generated outside the UK. With the British pound's fluctuations against other currencies, particularly the Euro and US Dollar, there is potential for revenue impacts. For instance, a 10% decline in the value of the pound could translate to an estimated £25 million decline in revenue due to currency translation effects.
Limited Market Penetration in Emerging Markets
While RS Group has a strong presence in established markets, its market penetration in emerging economies remains limited. As of the end of FY 2023, sales in emerging markets accounted for only 15% of total revenues, with significant barriers including local competition and regulatory challenges. This limited exposure affects growth prospects and reduces the company’s ability to capitalize on the rapid expansion opportunities available in these regions.
| Weakness Area | Percentage/Amount | Impact Description |
|---|---|---|
| Dependence on Third-Party Suppliers | 65% | Risk of supply chain disruptions affecting inventory levels. |
| High Operational Costs | £250 million | Increased expenses potentially reducing profit margins. |
| Currency Vulnerability | 30% | Exposure to international currency fluctuations potentially reducing revenues. |
| Market Penetration in Emerging Markets | 15% | Limited growth potential in higher growth economies. |
These weaknesses emphasize the importance of strategic initiatives in managing supplier relationships, controlling operational costs, hedging against currency risks, and expanding market presence in emerging economies to strengthen RS Group’s competitive positioning in the market.
RS Group plc - SWOT Analysis: Opportunities
RS Group plc has several avenues to explore for growth, particularly in the evolving global market landscape. Here are key opportunities that could be leveraged for expansion and enhanced performance:
Expansion into emerging markets with high growth potential
The demand for electronic components and related products is soaring in emerging markets. According to the International Monetary Fund (IMF), emerging economies are projected to grow at an average rate of 4.6% in 2024, compared to 2.1% for advanced economies. This growth opens vast opportunities for RS Group plc to increase its market share. For instance, the Asia-Pacific electronics market is expected to reach approximately $1.5 trillion by 2025, driven by rapid industrialization and technological advancements.
Strategic acquisitions to enhance product offerings
RS Group plc can pursue strategic acquisitions to enhance its product portfolio and market presence. The global electronic components market was valued at about $500 billion in 2022 and is expected to grow at a compound annual growth rate (CAGR) of 5.5% through 2030. In this context, acquiring companies that specialize in innovative product lines or niche markets could provide RS Group with a competitive edge and accelerate growth.
Increasing demand for sustainable and eco-friendly products
The push towards sustainability is reshaping consumer preferences. A report from McKinsey indicates that over 70% of consumers are willing to pay more for sustainable products. RS Group can capitalize on this trend by expanding its range of eco-friendly products. For instance, the market for sustainable electronic products is projected to grow from $69 billion in 2021 to approximately $110 billion by 2026, representing a CAGR of about 9.7%.
Leveraging technology to improve customer experience
Digital transformation is crucial for enhancing customer experience. RS Group can utilize advanced technologies such as artificial intelligence (AI) and machine learning (ML) to personalize customer interactions. According to a report by Statista, businesses that leverage AI could increase their profitability by up to 38% by 2035. Additionally, improving the online shopping experience through enhanced e-commerce platforms could attract younger demographics, as e-commerce sales are projected to exceed $6 trillion globally by 2024.
| Opportunity | Potential Growth | Market Value | Year of Projection |
|---|---|---|---|
| Emerging Markets Growth | 4.6% CAGR | $1.5 trillion | 2025 |
| Electronic Components Market | 5.5% CAGR | $500 billion | 2030 |
| Sustainable Products Demand | 9.7% CAGR | $110 billion | 2026 |
| AI-Driven Profit Increase | 38% Increase | N/A | 2035 |
| E-commerce Sales | Exceeds $6 trillion | $6 trillion | 2024 |
RS Group plc - SWOT Analysis: Threats
RS Group plc faces significant threats in a competitive landscape, where both global and local distributors put intense pressure on market share and pricing strategies. The company's competitors include major players such as Digi-Key Electronics, Mouser Electronics, and Avnet. In the fiscal year 2022, RS Group reported a revenue of £1.79 billion, while Digi-Key's revenue for the same period was approximately $3.24 billion and Mouser’s around $2.6 billion, demonstrating the scale of competition.
Economic downturns further exacerbate the challenges faced by RS Group. During the global recession triggered by the COVID-19 pandemic, consumer spending declined by approximately 6.4% in 2020 according to the Office for National Statistics (ONS). Such economic conditions lower demand for electronic components, impacting RS Group's sales and profitability. Additionally, inflation rates remain elevated, with the UK Consumer Price Index (CPI) reaching 10.1% in July 2022, eroding purchasing power and influencing discretionary spending.
Regulatory changes also pose a significant threat to RS Group's operations. The recent implementation of the UK’s Environment Act 2021 introduces stricter regulations regarding waste, resource efficiency, and sustainability. Compliance costs associated with these regulations are expected to rise. A report by the UK government indicated that businesses could collectively face £1 billion in compliance costs annually due to new environmental regulations.
Technological disruptions in supply chain processes represent another critical threat. The emergence of Industry 4.0—characterized by automation, data exchange, and smart manufacturing—challenges traditional supply chain models. According to a McKinsey report, companies that integrate digital technologies into their supply chains can reduce operating costs by as much as 25%. RS Group must adapt to these technological shifts or risk falling behind competitors who effectively leverage innovations to enhance operational efficiency.
| Threat | Description | Impact on RS Group | Financial Data |
|---|---|---|---|
| Intense Competition | Competition from distributors like Digi-Key and Mouser. | Pressure on market share and pricing. | RS Group revenue: £1.79 billion (FY 2022) |
| Economic Downturns | Decline in consumer spending due to recession. | Lower demand for products, impacting sales. | CPI at 10.1% (July 2022) |
| Regulatory Changes | New compliance costs from the Environment Act 2021. | Increased operational costs. | Estimated £1 billion in annual compliance costs (UK government) |
| Technological Disruptions | Adoption of digital technologies in supply chains. | Risk of inefficiency and lagging behind competitors. | Potential cost savings of 25% through technology integration (McKinsey) |
The SWOT analysis of RS Group plc reveals a company with strong foundations, characterized by a diverse product range and a solid distribution network, yet facing challenges like supplier dependence and high operational costs. With significant opportunities in emerging markets and sustainability, coupled with threats from competition and economic fluctuations, RS Group plc must strategically navigate its complexities to secure long-term growth and resilience.
Disclaimer
All information, articles, and product details provided on this website are for general informational and educational purposes only. We do not claim any ownership over, nor do we intend to infringe upon, any trademarks, copyrights, logos, brand names, or other intellectual property mentioned or depicted on this site. Such intellectual property remains the property of its respective owners, and any references here are made solely for identification or informational purposes, without implying any affiliation, endorsement, or partnership.
We make no representations or warranties, express or implied, regarding the accuracy, completeness, or suitability of any content or products presented. Nothing on this website should be construed as legal, tax, investment, financial, medical, or other professional advice. In addition, no part of this site—including articles or product references—constitutes a solicitation, recommendation, endorsement, advertisement, or offer to buy or sell any securities, franchises, or other financial instruments, particularly in jurisdictions where such activity would be unlawful.
All content is of a general nature and may not address the specific circumstances of any individual or entity. It is not a substitute for professional advice or services. Any actions you take based on the information provided here are strictly at your own risk. You accept full responsibility for any decisions or outcomes arising from your use of this website and agree to release us from any liability in connection with your use of, or reliance upon, the content or products found herein.