
|
SEGRO Plc (SGRO.L) DCF Valuation |
Fully Editable: Tailor To Your Needs In Excel Or Sheets
Professional Design: Trusted, Industry-Standard Templates
Investor-Approved Valuation Models
MAC/PC Compatible, Fully Unlocked
No Expertise Is Needed; Easy To Follow
SEGRO Plc (SGRO.L) Bundle
Engineered for accuracy, our SEGRO Plc (SGROL) DCF Calculator empowers you to assess SEGRO Plc valuation using comprehensive financial data and complete flexibility to modify all essential parameters for enhanced projections.
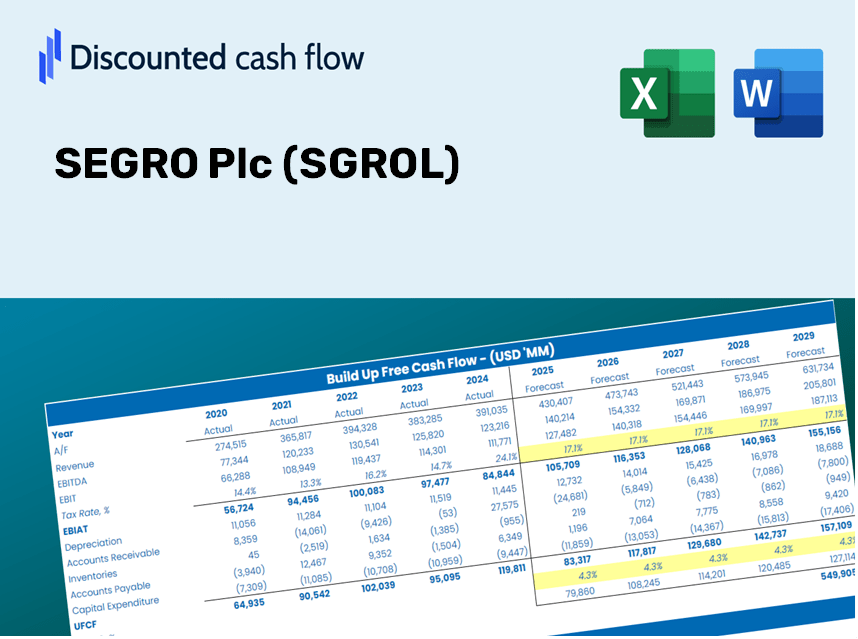
Discounted Cash Flow (DCF) - (USD MM)
| Year | AY1 2021 |
AY2 2022 |
AY3 2023 |
AY4 2024 |
AY5 2025 |
FY1 2026 |
FY2 2027 |
FY3 2028 |
FY4 2029 |
FY5 2030 |
|---|---|---|---|---|---|---|---|---|---|---|
| Revenue | 546.0 | 669.0 | 749.0 | 675.0 | 726.0 | 764.8 | 793.7 | 814.8 | 830.2 | 841.3 |
| Revenue Growth, % | 0 | 22.53 | 11.96 | -9.88 | 7.56 | 5.34 | 3.78 | 2.67 | 1.89 | 1.33 |
| EBITDA | 270.0 | -1,878.0 | -134.0 | 763.0 | 670.0 | 189.4 | 196.6 | 201.8 | 205.6 | 208.4 |
| EBITDA, % | 49.45 | -280.72 | -17.89 | 113.04 | 92.29 | 24.77 | 24.77 | 24.77 | 24.77 | 24.77 |
| Depreciation | 5.0 | 4.0 | 6.0 | 12.0 | 17.0 | 21.0 | 24.9 | 28.8 | 32.6 | 36.3 |
| Depreciation, % | 0.91575 | 0.59791 | 0.80107 | 1.78 | 2.34 | 2.74 | 3.14 | 3.53 | 3.93 | 4.32 |
| EBIT | 265.0 | -1,882.0 | -140.0 | 751.0 | 653.0 | 183.2 | 190.1 | 195.2 | 198.9 | 201.6 |
| EBIT, % | 48.53 | -281.32 | -18.69 | 111.26 | 89.94 | 23.96 | 23.96 | 23.96 | 23.96 | 23.96 |
| Total Cash | 45.0 | 162.0 | 376.0 | 292.0 | 111.0 | 216.0 | 224.1 | 230.1 | 234.5 | 237.6 |
| Total Cash, percent | .0 | .0 | .0 | .0 | .0 | .0 | .0 | .0 | .0 | .0 |
| Account Receivables | 197.0 | 182.0 | 63.0 | 159.0 | 208.0 | 189.5 | 196.7 | 201.9 | 205.7 | 208.5 |
| Account Receivables, % | 36.08 | 27.2 | 8.41 | 23.56 | 28.65 | 24.78 | 24.78 | 24.78 | 24.78 | 24.78 |
| Inventories | 45.0 | 35.0 | 3.0 | 6.0 | .0 | 22.6 | 23.4 | 24.1 | 24.5 | 24.8 |
| Inventories, % | 8.24 | 5.23 | 0.40053 | 0.88889 | 0 | 2.95 | 2.95 | 2.95 | 2.95 | 2.95 |
| Accounts Payable | 5.0 | 10.0 | 10.0 | 7.0 | .0 | 7.3 | 7.6 | 7.8 | 7.9 | 8.0 |
| Accounts Payable, % | 0.91575 | 1.49 | 1.34 | 1.04 | 0 | 0.95653 | 0.95653 | 0.95653 | 0.95653 | 0.95653 |
| Capital Expenditure | -7.0 | -9.0 | -29.0 | -24.0 | -29.0 | -21.5 | -22.3 | -22.9 | -23.3 | -23.6 |
| Capital Expenditure, % | -1.28 | -1.35 | -3.87 | -3.56 | -3.99 | -2.81 | -2.81 | -2.81 | -2.81 | -2.81 |
| Tax Rate, % | 1.61 | 1.61 | 1.61 | 1.61 | 1.61 | 1.61 | 1.61 | 1.61 | 1.61 | 1.61 |
| EBITAT | 276.3 | -1,989.4 | -134.7 | 701.4 | 642.5 | 178.8 | 185.6 | 190.5 | 194.1 | 196.7 |
| Depreciation | ||||||||||
| Changes in Account Receivables | ||||||||||
| Changes in Inventories | ||||||||||
| Changes in Accounts Payable | ||||||||||
| Capital Expenditure | ||||||||||
| UFCF | 37.3 | -1,964.4 | -6.7 | 587.4 | 580.5 | 181.5 | 180.4 | 190.7 | 199.3 | 206.4 |
| WACC, % | 6.97 | 6.97 | 6.92 | 6.89 | 6.95 | 6.94 | 6.94 | 6.94 | 6.94 | 6.94 |
| PV UFCF | ||||||||||
| SUM PV UFCF | 783.5 | |||||||||
| Long Term Growth Rate, % | 3.50 | |||||||||
| Free cash flow (T + 1) | 214 | |||||||||
| Terminal Value | 6,214 | |||||||||
| Present Terminal Value | 4,443 | |||||||||
| Enterprise Value | 5,226 | |||||||||
| Net Debt | 4,840 | |||||||||
| Equity Value | 386 | |||||||||
| Diluted Shares Outstanding, MM | 1,355 | |||||||||
| Equity Value Per Share | 28.51 |
What You Will Receive
- Accurate SEGRO Financials: Access historical and projected data for precise valuation.
- Customizable Parameters: Adjust WACC, tax rates, revenue growth, and capital expenditures as needed.
- Real-Time Calculations: Intrinsic value and NPV calculated automatically.
- Scenario Testing: Explore various scenarios to assess SEGRO’s potential future performance.
- User-Friendly Interface: Designed for industry experts while remaining approachable for newcomers.
Key Features
- Real-Time SEGRO Data: Pre-loaded with SEGRO Plc’s historical performance metrics and forward-looking estimates.
- Fully Customizable Inputs: Tailor revenue growth, profit margins, WACC, tax rates, and capital expenditures to your preferences.
- Dynamic Valuation Model: Automatically recalculates Net Present Value (NPV) and intrinsic value based on your user-defined inputs.
- Scenario Testing: Develop various forecasting scenarios to evaluate different valuation results.
- User-Friendly Interface: Intuitive design that caters to both seasoned professionals and newcomers.
How It Functions
- Step 1: Download the Excel spreadsheet.
- Step 2: Examine the pre-filled SEGRO Plc (SGROL) data (historical and projected).
- Step 3: Modify key assumptions (highlighted in yellow) according to your analysis.
- Step 4: Observe automatic recalculations for SEGRO Plc’s intrinsic value.
- Step 5: Utilize the results for investment decisions or reporting purposes.
Why Choose SEGRO Plc (SGROL) Calculator?
- Time Efficient: Skip the hassle of building a DCF model from the ground up – it's ready to go.
- Enhanced Precision: Dependable financial data and formulas minimize valuation errors.
- Completely Customizable: Adjust the model to align with your unique assumptions and forecasts.
- User-Friendly: Intuitive charts and outputs simplify result analysis.
- Endorsed by Professionals: Crafted for experts who prioritize accuracy and functionality.
Who Can Benefit from SEGRO Plc (SGROL)?
- Investors: Enhance your investment strategies with a reliable valuation tool tailored for informed decision-making.
- Financial Analysts: Streamline your workflow with a customizable DCF model designed for efficiency.
- Consultants: Easily modify the template for compelling client presentations or comprehensive reports.
- Finance Enthusiasts: Expand your knowledge of valuation methods through practical, real-world applications.
- Educators and Students: Leverage it as an effective resource for hands-on learning in finance courses.
Contents of the Template
- Pre-Filled Data: Features SEGRO Plc's historical financials and projected figures.
- Discounted Cash Flow Model: An editable DCF valuation model with automated calculations.
- Weighted Average Cost of Capital (WACC): A dedicated worksheet for calculating WACC using custom inputs.
- Key Financial Ratios: Evaluate SEGRO Plc's profitability, efficiency, and financial leverage.
- Customizable Inputs: Easily modify revenue growth rates, profit margins, and tax rates.
- Clear Dashboard: Visual representations and tables summarizing essential valuation outcomes.
Disclaimer
All information, articles, and product details provided on this website are for general informational and educational purposes only. We do not claim any ownership over, nor do we intend to infringe upon, any trademarks, copyrights, logos, brand names, or other intellectual property mentioned or depicted on this site. Such intellectual property remains the property of its respective owners, and any references here are made solely for identification or informational purposes, without implying any affiliation, endorsement, or partnership.
We make no representations or warranties, express or implied, regarding the accuracy, completeness, or suitability of any content or products presented. Nothing on this website should be construed as legal, tax, investment, financial, medical, or other professional advice. In addition, no part of this site—including articles or product references—constitutes a solicitation, recommendation, endorsement, advertisement, or offer to buy or sell any securities, franchises, or other financial instruments, particularly in jurisdictions where such activity would be unlawful.
All content is of a general nature and may not address the specific circumstances of any individual or entity. It is not a substitute for professional advice or services. Any actions you take based on the information provided here are strictly at your own risk. You accept full responsibility for any decisions or outcomes arising from your use of this website and agree to release us from any liability in connection with your use of, or reliance upon, the content or products found herein.