
|
Stanley Black & Decker, Inc. (SWK) DCF Valuation |
Fully Editable: Tailor To Your Needs In Excel Or Sheets
Professional Design: Trusted, Industry-Standard Templates
Investor-Approved Valuation Models
MAC/PC Compatible, Fully Unlocked
No Expertise Is Needed; Easy To Follow
Stanley Black & Decker, Inc. (SWK) Bundle
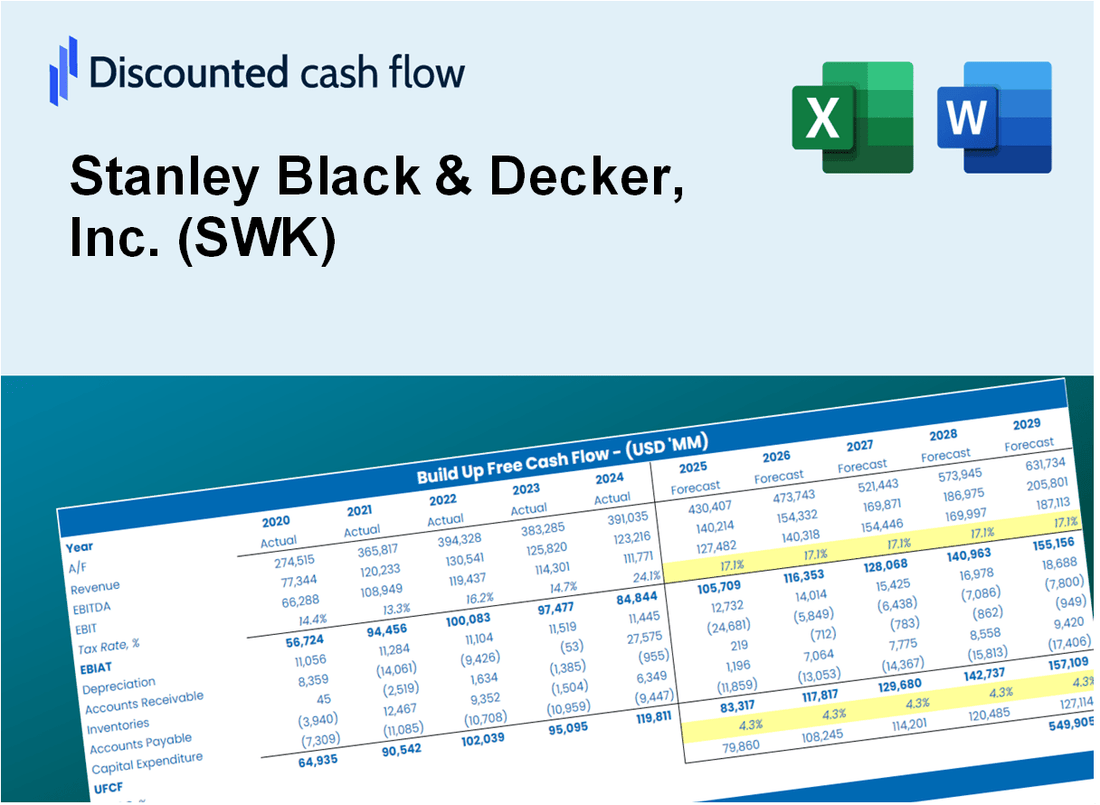
Gain insight into your Stanley Black & Decker, Inc. (SWK) valuation analysis with our sophisticated DCF Calculator! Preloaded with authentic (SWK) data, this Excel template enables you to adjust forecasts and assumptions to accurately determine the intrinsic value of Stanley Black & Decker, Inc.
What You Will Receive
- Pre-Filled Financial Model: Stanley Black & Decker’s actual data facilitates accurate DCF valuation.
- Comprehensive Forecast Control: Modify revenue growth, profit margins, WACC, and other crucial factors.
- Real-Time Calculations: Automatic updates allow you to view results instantly as adjustments are made.
- Professional-Grade Template: A polished Excel file crafted for high-quality valuation.
- Customizable and Reusable: Designed for adaptability, enabling repeated use for in-depth forecasts.
Key Features
- Customizable Financial Inputs: Adjust essential factors such as revenue growth, operating margin, and capital investments.
- Instant DCF Valuation: Quickly computes intrinsic value, net present value (NPV), and other financial metrics.
- High-Precision Accuracy: Leverages Stanley Black & Decker's (SWK) actual financial data for dependable valuation results.
- Effortless Scenario Testing: Easily evaluate various assumptions and analyze different outcomes.
- Efficiency Booster: Avoid the hassle of constructing intricate valuation models from the ground up.
How It Works
- 1. Open the Template: Download and open the Excel file containing Stanley Black & Decker, Inc.'s (SWK) preloaded data.
- 2. Edit Assumptions: Modify key inputs such as growth rates, WACC, and capital expenditures.
- 3. View Results Instantly: The DCF model automatically calculates intrinsic value and NPV.
- 4. Test Scenarios: Evaluate various forecasts to explore different valuation outcomes.
- 5. Use with Confidence: Present professional valuation insights to bolster your decision-making.
Why Choose This Calculator for Stanley Black & Decker, Inc. (SWK)?
- Accuracy: Utilizes real Stanley Black & Decker financial data to ensure precise calculations.
- Flexibility: Allows users to easily test and adjust inputs according to their needs.
- Time-Saving: Eliminates the need to create a financial model from the ground up.
- Professional-Grade: Crafted with the expertise and usability expected at the CFO level.
- User-Friendly: Intuitive design makes it accessible for users without extensive financial modeling skills.
Who Should Use Stanley Black & Decker, Inc. (SWK)?
- Investors: Make informed investment choices with insights from a leading manufacturer in tools and security solutions.
- Financial Analysts: Streamline your analysis using comprehensive financial data and reports from a reputable company.
- Consultants: Easily tailor presentations and strategies based on Stanley Black & Decker's market performance and innovations.
- Industry Enthusiasts: Enhance your knowledge of the tools and hardware sector through Stanley Black & Decker's extensive product offerings.
- Educators and Students: Utilize the company's case studies and resources for practical applications in business and finance education.
What the Template Contains
- Preloaded SWK Data: Historical and projected financial data, including revenue, EBIT, and capital expenditures.
- DCF and WACC Models: Professional-grade sheets for calculating intrinsic value and Weighted Average Cost of Capital.
- Editable Inputs: Yellow-highlighted cells for adjusting revenue growth, tax rates, and discount rates.
- Financial Statements: Comprehensive annual and quarterly financials for deeper analysis.
- Key Ratios: Profitability, leverage, and efficiency ratios to evaluate performance.
- Dashboard and Charts: Visual summaries of valuation outcomes and assumptions.
Disclaimer
All information, articles, and product details provided on this website are for general informational and educational purposes only. We do not claim any ownership over, nor do we intend to infringe upon, any trademarks, copyrights, logos, brand names, or other intellectual property mentioned or depicted on this site. Such intellectual property remains the property of its respective owners, and any references here are made solely for identification or informational purposes, without implying any affiliation, endorsement, or partnership.
We make no representations or warranties, express or implied, regarding the accuracy, completeness, or suitability of any content or products presented. Nothing on this website should be construed as legal, tax, investment, financial, medical, or other professional advice. In addition, no part of this site—including articles or product references—constitutes a solicitation, recommendation, endorsement, advertisement, or offer to buy or sell any securities, franchises, or other financial instruments, particularly in jurisdictions where such activity would be unlawful.
All content is of a general nature and may not address the specific circumstances of any individual or entity. It is not a substitute for professional advice or services. Any actions you take based on the information provided here are strictly at your own risk. You accept full responsibility for any decisions or outcomes arising from your use of this website and agree to release us from any liability in connection with your use of, or reliance upon, the content or products found herein.