|
TaskUs, Inc. (TASK): BCG Matrix [Dec-2025 Updated] |
Fully Editable: Tailor To Your Needs In Excel Or Sheets
Professional Design: Trusted, Industry-Standard Templates
Investor-Approved Valuation Models
MAC/PC Compatible, Fully Unlocked
No Expertise Is Needed; Easy To Follow
TaskUs, Inc. (TASK) Bundle
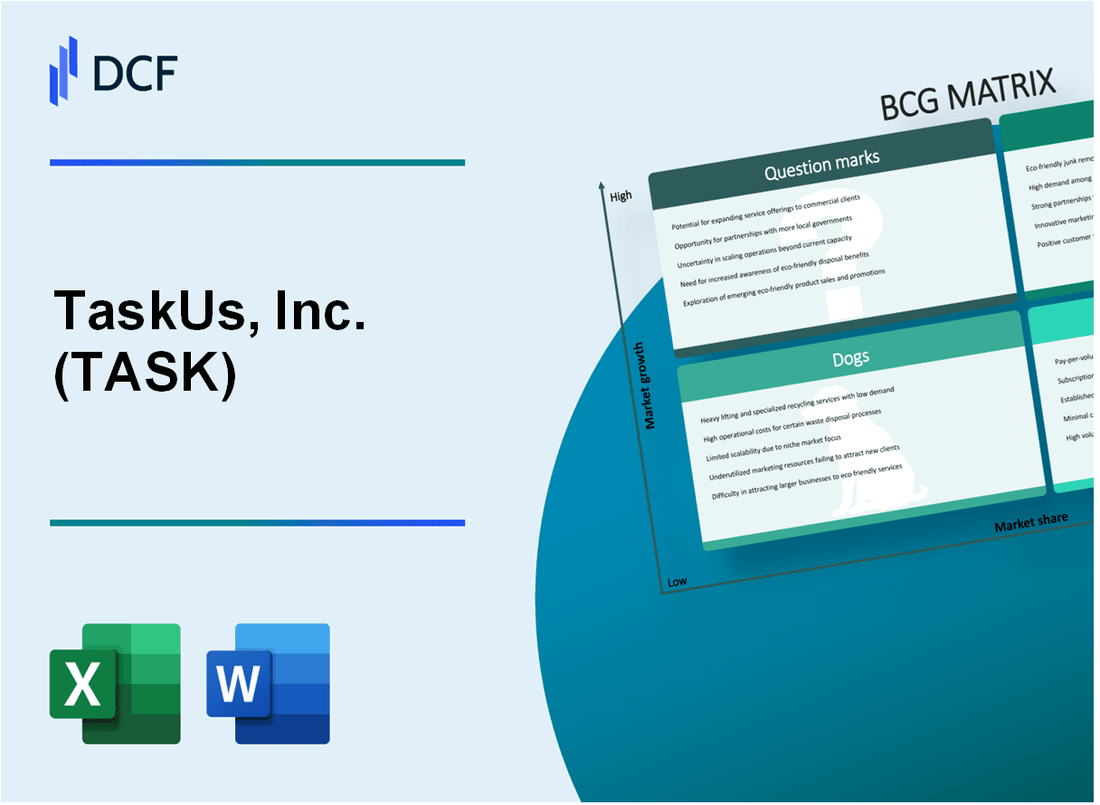
You're looking for a clear-eyed view of TaskUs, Inc.'s (TASK) business portfolio as of late 2025, and the BCG Matrix is the perfect tool to map their strategic position. We've mapped their units: the high-flying Stars like AI Services, exploding with 63.7% revenue growth, are being bankrolled by the rock-solid Cash Cows-the core Digital Customer Experience business delivering a 21.2% Adjusted EBITDA margin. Still, you've got the legacy voice Dogs facing automation risk and the high-potential, high-cost Question Marks like Trust + Safety, which grew nearly 20% but needs heavy investment to prove its long-term worth. Defintely, understanding this balance is key to knowing where TaskUs is placing its bets for the next cycle.
Background of TaskUs, Inc. (TASK)
You're looking at TaskUs, Inc. (TASK), which is a major player in outsourced digital services and next-generation customer experience, helping some of the world's most innovative companies manage their digital needs. As of late 2025, the company has been delivering some impressive numbers, showing they're successfully navigating the shift toward AI-centric services. Honestly, they've managed to keep a tight ship on operations while chasing that high-growth tech demand.
Let's look at the numbers from the third quarter ended September 30, 2025. TaskUs, Inc. posted record total revenues of $298.7 million, which was a solid 17.0% year-over-year growth. That quarter saw net income jump to $31.4 million, giving them a net income margin of 10.5%. On the profitability front, their Adjusted EBITDA came in at $63.5 million, translating to an Adjusted EBITDA margin of 21.2%, which management points out is among the best in their industry. Plus, they generated $42.0 million in Free Cash Flow for that quarter.
The real story here is the mix shift in their service offerings. Their AI Services segment is the clear growth engine, marking its third consecutive quarter of massive expansion with year-over-year growth of more than 60% in Q3 2025; that segment alone brought in $58.7 million in revenue. The Trust + Safety segment also showed strong momentum, with revenue growing nearly 20% year-over-year. These two areas are clearly driving the top-line acceleration, even as they plan to increase investments in Generative AI transformation services.
For the full fiscal year 2025, TaskUs, Inc. expects total revenue to land between $1.173 billion and $1.175 billion, targeting an Adjusted EBITDA margin of about 21.1% and Adjusted Free Cash Flow of approximately $100 million. To support this, the company ended Q3 2025 with a worldwide headcount of 63,800 teammates. What this estimate hides, however, is the near-term margin pressure they anticipate from wage hikes and those very growth investments, which is something we'll need to watch closely. Finance: draft 13-week cash view by Friday.
TaskUs, Inc. (TASK) - BCG Matrix: Stars
The Stars quadrant for TaskUs, Inc. (TASK) is clearly occupied by its Artificial Intelligence (AI) Services business unit. This segment represents the company's highest growth area, demanding significant investment to maintain market leadership in a rapidly expanding market space.
AI Services demonstrated exceptional top-line performance, posting a revenue growth of 63.7% for the nine months ended September 30, 2025. This growth rate significantly outpaced the total company revenue growth of 20.8% over the same nine-month period. This unit is the primary engine driving TaskUs, Inc.'s overall momentum, positioning it as a leader in the business but requiring substantial cash outlay for promotion, talent acquisition, and technology scaling.
The focus within this segment is heavily weighted toward the newest, most dynamic areas of AI application, such as Generative AI data curation and Large Language Model (LLM) red teaming. For the third quarter of 2025, the broader AI Services line delivered year-over-year revenue growth exceeding 60%, with the specific Q3 2025 revenue for AI Services reported at $58.7M. This high-growth, high-investment segment is strategically positioned to capture the massive AI-driven market shift, which the company plans to fuel by increasing its investments in Generative AI led transformation services.
You can see the stark contrast in growth dynamics when comparing this Star segment to the company's total performance for the third quarter of 2025:
| Metric | AI Services Segment | TaskUs, Inc. (Total) |
| Nine-Month 2025 Revenue Growth | 63.7% | 20.8% |
| Q3 2025 Revenue Growth (YoY) | 60.8% | 17.0% |
| Q3 2025 Revenue Amount | $58.7M | $298.7 million |
To accelerate its position in Agentic AI-Powered Customer Experience, TaskUs, Inc. has established strategic partnerships. These include alliances with Decagon and Regal, both elite agentic AI platform companies. The CEO noted that deploying Agentic AI through these platforms should enable the company to reduce customer support costs by 25-50% while improving quality. This investment in next-generation automation is key to ensuring the AI Services unit sustains its market share until the high-growth market matures and the segment transitions into a Cash Cow.
The current activities supporting this Star segment include:
- AI Services revenue growth for nine months 2025: 63.7%.
- Q3 2025 AI Services year-over-year growth: over 60%.
- Q3 2025 AI Services revenue contribution: $58.7M.
- Strategic partnerships with Decagon and Regal announced in May 2025.
- Expected cost reduction from Agentic AI deployment: 25-50%.
If TaskUs, Inc. maintains its success in this high-growth area, it is expected to evolve into a Cash Cow as the overall market growth rate inevitably slows down. Finance: draft the 13-week cash view by Friday, focusing on capital allocation to AI Services.
TaskUs, Inc. (TASK) - BCG Matrix: Cash Cows
You're looking at the engine room of TaskUs, Inc., the business units that have already won their market share and now just need careful management to keep printing cash. These are the established, high-margin service lines in non-voice channels, which management notes are over 80% digital.
The Digital Customer Experience (DCX) core business is definitely providing that stable, high-quality revenue stream you want from a Cash Cow. For the third quarter of 2025, DCX generated revenue of $164.2 million. This segment's performance helps keep the overall company financials rock solid.
TaskUs, Inc. posted an overall Adjusted EBITDA margin of 21.2% in Q3 2025, which the CEO noted is among the best in the industry. For the full year 2025, the company projects this margin to hold steady at approximately 21.1%. This high profitability is the hallmark of a mature, market-leading position.
This operational efficiency translates directly to cash generation. TaskUs, Inc. is projecting to generate approximately $100 million in Adjusted Free Cash Flow for the full year 2025. In Q3 2025 alone, the company realized $48.0 million in Adjusted Free Cash Flow, representing a strong 75.6% conversion rate from Adjusted EBITDA.
This reliable cash flow is the foundation that funds the aggressive investment in the AI Services Star segment. It covers the corporate overhead and provides the necessary capital for growth initiatives elsewhere in the portfolio. Here's the quick math on the Q3 2025 cash generation:
| Metric | Amount (Q3 2025) |
| Total Revenue | $298.7 million |
| Adjusted EBITDA | $63.5 million |
| Net Cash from Operating Activities | $54.3 million |
| Adjusted Free Cash Flow | $48.0 million |
The Cash Cow segment's stability is what allows TaskUs, Inc. to pursue high-growth, high-investment areas. For context, while the DCX segment provides the base, the AI Services segment saw revenue growth of 60.8% year-over-year in Q3 2025. The Cash Cows generate the bulk of the cash required to fuel that Star segment's expansion.
You can see the financial discipline in the balance sheet strength derived from these consistent cash flows. As of the end of Q3 2025, TaskUs, Inc. held $210 million in cash and cash equivalents, with a net debt-to-Adjusted EBITDA ratio below 0.2x. This is defintely a position of strength.
Key characteristics supporting the Cash Cow status include:
- DCX Q3 2025 Revenue: $164.2 million.
- Full Year 2025 Projected Adjusted EBITDA Margin: approximately 21.1%.
- Full Year 2025 Projected Adjusted Free Cash Flow: approximately $100 million.
- Total Teammates (End of Q3 2025): 63,800.
- High client stickiness, with multiple-service-line clients growing revenues over 20%.
Companies are advised to invest in cash cows to maintain the current level of productivity or to 'milk' the gains passively. For TaskUs, Inc., this means maintaining operational efficiency in DCX while channeling the excess cash toward the future, like the AI Services segment.
TaskUs, Inc. (TASK) - BCG Matrix: Dogs
You're looking at the part of the TaskUs, Inc. (TASK) portfolio that isn't getting the spotlight, the services that are mature and facing structural headwinds. These are the units requiring tight operational control, not big capital injections.
Commoditized Tier 1 customer support, especially legacy voice-only channels, falls squarely into this category. While TaskUs, Inc. (TASK) is aggressively pushing AI Services, which saw revenue growth of 60.8% year-over-year in Q3 2025, the traditional service lines are seeing much slower movement. The Digital Customer Experience (DCX) offering, which houses these legacy channels, generated $164.2 million in revenue for the third quarter of 2025.
The growth story for this segment is clearly one of low velocity. TaskUs, Inc. (TASK) reported that the DCX service line saw only 5.8% year-over-year growth in Q3 2025. Management expects full-year 2025 DCX growth to be in the high single digits, which contrasts sharply with the >60% growth in AI Services and the nearly 20% growth in Trust + Safety during the same period.
This segment is inherently facing pricing pressures and high risk of automation displacement. The overall Operating Margin for TaskUs, Inc. (TASK) in Q3 2025 was 12.7%, which is significantly lower than the company's Adjusted EBITDA Margin of 21.2% for the same quarter. This margin compression reflects the lower value-add nature of commoditized support relative to specialized offerings.
The operational mandate here is efficiency. This segment requires minimal new investment but consumes management time for operational efficiency. It represents the most basic, non-specialized services TaskUs offers, meaning the focus shifts to cost-to-serve optimization rather than market share expansion.
Here is a quick comparison of the service line momentum as of Q3 2025:
| Service Line | Q3 2025 Revenue Contribution (Partial) | Q3 2025 Year-over-Year Growth Rate |
| AI Services | Not explicitly stated | >60% (or 60.8%) |
| Trust + Safety | Not explicitly stated | ~20% (or 19.1%) |
| Digital Customer Experience (DCX) | $164.2 million | 5.8% |
The low growth and lower relative margin profile suggest these units are candidates for minimizing cash consumption. You need to look at the cost structure of the DCX segment to determine the exact cash burn or break-even point, but the trend is clear: these are the legacy operations.
- The DCX segment revenue was $164.2 million in Q3 2025.
- The year-over-year growth for DCX was 5.8% in Q3 2025.
- The company's overall Operating Margin in Q3 2025 was 12.7%.
- The company expects full-year 2025 revenue to be between $1.173 billion and $1.175 billion.
Finance: draft 13-week cash view by Friday.
TaskUs, Inc. (TASK) - BCG Matrix: Question Marks
The Trust + Safety services segment of TaskUs, Inc. fits the profile of a Question Mark: a high-growth area where TaskUs, Inc. is actively competing for market share.
Trust + Safety services showed strong top-line momentum, with year-over-year revenue growth of nearly 20% in the third quarter of 2025, reaching $75.8M in revenue for that period. Looking at the longer trend, revenue for the nine months ended September 30, 2025, grew by 26.2% in this service line. This follows even stronger growth earlier in the year, with Q1 2025 seeing growth above 30% for the fifth consecutive quarter, and Q2 2025 maintaining strength at nearly 30% growth.
This high growth is directly tied to the expanding market environment. The overall Trust and Safety Services market size was estimated to be approximately $15 billion in 2025. This reflects the high market growth driven by regulatory demands and the constant need for content moderation on social media and other digital platforms. TaskUs, Inc. has been recognized as a Leader in the Everest Group's Trust and Safety Services PEAK Matrix® Assessment for the third consecutive year in 2025, validating its capability in this space.
The need to maintain this growth and quality requires significant cash consumption. The cost of service as a percentage of revenue increased to 62.1% in Q3 2025, up from 60.2% in Q3 of the prior year. Management attributed this increase partly to investments in physical and information security and ramp costs associated with revenue growth. Furthermore, Selling, General & Administrative (SG&A) expenses were $59.7M, representing 20% of revenue for the third quarter. The company scaled its global workforce to support this, ending Q3 2025 with 63,800 teammates.
The Question Mark status is cemented by the fact that while growth is high, the segment is still establishing its long-term profitability and market share dominance against competitors, necessitating heavy, continuous investment. The future of this segment hinges on TaskUs, Inc.'s ability to successfully scale its operations while effectively managing these high operational costs.
| Metric | Value (2025) | Time Period/Context |
| Trust + Safety Revenue Growth | 26.2% | Nine Months Ended September 30, 2025 |
| Trust + Safety Revenue Growth | Nearly 20% | Third Quarter 2025 Year-over-Year |
| Trust + Safety Revenue Growth | Above 30% | First Quarter 2025, Fifth Consecutive Quarter |
| Trust + Safety Revenue Amount | $75.8M | Third Quarter 2025 |
| Total Company Revenue | $298.7M | Third Quarter 2025 |
| Cost of Service (% of Revenue) | 62.1% | Third Quarter 2025 |
| Cost of Service (% of Revenue) | 60.2% | Third Quarter Prior Year |
| SG&A Expenses (% of Revenue) | 20% | Third Quarter 2025 |
| Total Teammates | 63,800 | End of Third Quarter 2025 |
| Estimated Trust & Safety Market Size | $15 billion | 2025 Estimate |
The required investment to maintain pace in this high-growth market is evident in the operational metrics:
- Cost of service as a percentage of revenue rose to 62.1% in Q3 2025.
- SG&A expenses were $59.7M, or 20% of Q3 2025 revenue.
- Headcount grew to 63,800 teammates by the end of Q3 2025.
Disclaimer
All information, articles, and product details provided on this website are for general informational and educational purposes only. We do not claim any ownership over, nor do we intend to infringe upon, any trademarks, copyrights, logos, brand names, or other intellectual property mentioned or depicted on this site. Such intellectual property remains the property of its respective owners, and any references here are made solely for identification or informational purposes, without implying any affiliation, endorsement, or partnership.
We make no representations or warranties, express or implied, regarding the accuracy, completeness, or suitability of any content or products presented. Nothing on this website should be construed as legal, tax, investment, financial, medical, or other professional advice. In addition, no part of this site—including articles or product references—constitutes a solicitation, recommendation, endorsement, advertisement, or offer to buy or sell any securities, franchises, or other financial instruments, particularly in jurisdictions where such activity would be unlawful.
All content is of a general nature and may not address the specific circumstances of any individual or entity. It is not a substitute for professional advice or services. Any actions you take based on the information provided here are strictly at your own risk. You accept full responsibility for any decisions or outcomes arising from your use of this website and agree to release us from any liability in connection with your use of, or reliance upon, the content or products found herein.