
|
Taboola.com, Ltd. (TBLAW) DCF Valuation |
Fully Editable: Tailor To Your Needs In Excel Or Sheets
Professional Design: Trusted, Industry-Standard Templates
Investor-Approved Valuation Models
MAC/PC Compatible, Fully Unlocked
No Expertise Is Needed; Easy To Follow
Taboola.com, Ltd. (TBLAW) Bundle
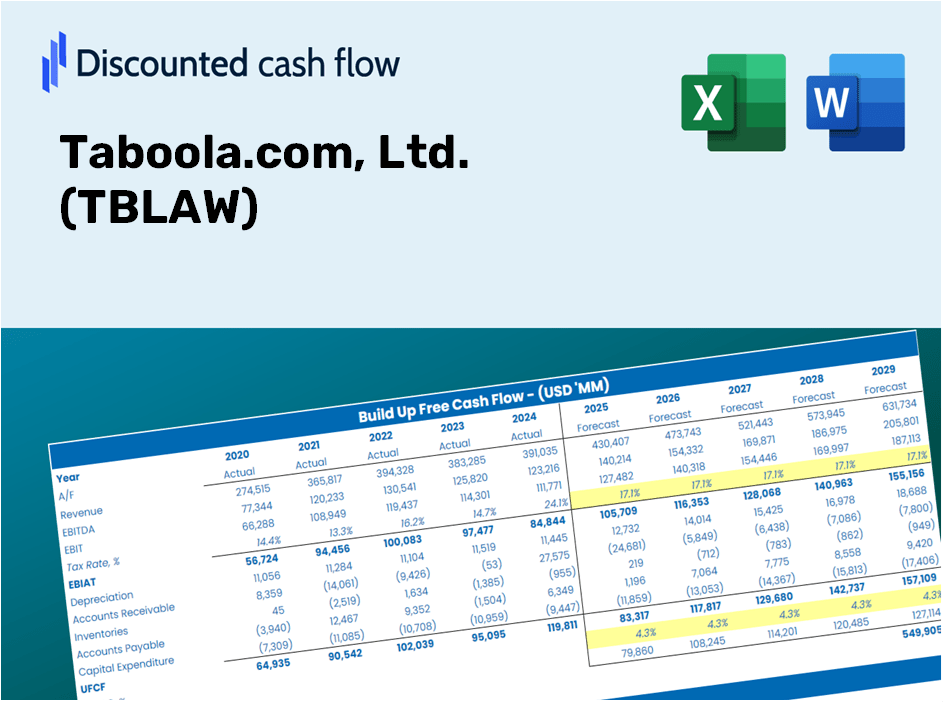
Whether you're an investor or analyst, this (TBLAW) DCF Calculator is your go-to resource for accurate valuation. Preloaded with data from Taboola.com, Ltd., you can adjust forecasts and instantly observe the effects.
What You Will Receive
- Authentic TBLAW Financial Data: Pre-populated with Taboola’s historical and forecasted financials for accurate analysis.
- Completely Customizable Template: Effortlessly adjust key variables such as revenue growth, WACC, and EBITDA percentage.
- Instant Calculations: Witness real-time updates of Taboola’s intrinsic value as you make modifications.
- Expert Valuation Tool: Tailored for investors, analysts, and consultants who need precise DCF results.
- Intuitive User Experience: Streamlined layout and straightforward instructions suitable for users of all skill levels.
Key Features
- Comprehensive DCF Calculator: Features detailed unlevered and levered DCF valuation models tailored for Taboola.com, Ltd. (TBLAW).
- WACC Tool: Pre-designed Weighted Average Cost of Capital sheet with adjustable inputs for precise calculations.
- Customizable Forecast Inputs: Adjust growth projections, capital expenditures, and discount rates according to your analysis needs.
- Integrated Financial Ratios: Evaluate profitability, leverage, and efficiency ratios specifically for Taboola.com, Ltd. (TBLAW).
- Visual Dashboard and Charts: Graphical representations of key valuation metrics for straightforward analysis.
How It Works
- Download: Obtain the pre-configured Excel file containing Taboola.com, Ltd.'s (TBLAW) financial data.
- Customize: Modify projections, including revenue growth, EBITDA %, and WACC to fit your analysis.
- Update Automatically: Intrinsic value and NPV calculations refresh in real-time as you make changes.
- Test Scenarios: Develop various forecasts and instantly compare the results.
- Make Decisions: Utilize the valuation insights to inform your investment approach.
Why Choose This Calculator for Taboola.com, Ltd. (TBLAW)?
- User-Friendly Design: Perfect for both newcomers and seasoned professionals.
- Customizable Inputs: Adjust parameters effortlessly to suit your analysis needs.
- Real-Time Insights: Witness immediate updates to Taboola's valuation as you change inputs.
- Preloaded Financials: Comes equipped with Taboola’s actual financial data for swift evaluations.
- Preferred by Experts: Valued by investors and analysts for making well-informed decisions.
Who Could Benefit from This Product?
- Professional Investors: Create comprehensive and trustworthy valuation models for analyzing portfolios involving Taboola.com, Ltd. (TBLAW).
- Corporate Finance Teams: Evaluate valuation scenarios to inform strategic decisions within the organization.
- Consultants and Advisors: Deliver precise valuation insights related to Taboola.com, Ltd. (TBLAW) for client consultations.
- Students and Educators: Utilize real-world data to enhance learning and practice in financial modeling related to Taboola.com, Ltd. (TBLAW).
- Tech Enthusiasts: Gain insights into the valuation processes of tech companies like Taboola.com, Ltd. (TBLAW) in the marketplace.
What the Template Contains
- Historical Data: Contains Taboola.com, Ltd.'s (TBLAW) previous financial records and baseline projections.
- DCF and Levered DCF Models: Comprehensive templates for assessing the intrinsic value of Taboola.com, Ltd. (TBLAW).
- WACC Sheet: Built-in calculations for Weighted Average Cost of Capital.
- Editable Inputs: Adjust essential parameters such as growth rates, EBITDA %, and CAPEX assumptions.
- Quarterly and Annual Statements: A thorough analysis of Taboola.com, Ltd.'s (TBLAW) financial performance.
- Interactive Dashboard: Dynamically visualize valuation outcomes and forecasts.
Disclaimer
All information, articles, and product details provided on this website are for general informational and educational purposes only. We do not claim any ownership over, nor do we intend to infringe upon, any trademarks, copyrights, logos, brand names, or other intellectual property mentioned or depicted on this site. Such intellectual property remains the property of its respective owners, and any references here are made solely for identification or informational purposes, without implying any affiliation, endorsement, or partnership.
We make no representations or warranties, express or implied, regarding the accuracy, completeness, or suitability of any content or products presented. Nothing on this website should be construed as legal, tax, investment, financial, medical, or other professional advice. In addition, no part of this site—including articles or product references—constitutes a solicitation, recommendation, endorsement, advertisement, or offer to buy or sell any securities, franchises, or other financial instruments, particularly in jurisdictions where such activity would be unlawful.
All content is of a general nature and may not address the specific circumstances of any individual or entity. It is not a substitute for professional advice or services. Any actions you take based on the information provided here are strictly at your own risk. You accept full responsibility for any decisions or outcomes arising from your use of this website and agree to release us from any liability in connection with your use of, or reliance upon, the content or products found herein.