
|
Taboola.com, Ltd. (TBLAW): Marketing Mix Analysis |
Fully Editable: Tailor To Your Needs In Excel Or Sheets
Professional Design: Trusted, Industry-Standard Templates
Investor-Approved Valuation Models
MAC/PC Compatible, Fully Unlocked
No Expertise Is Needed; Easy To Follow
Taboola.com, Ltd. (TBLAW) Bundle
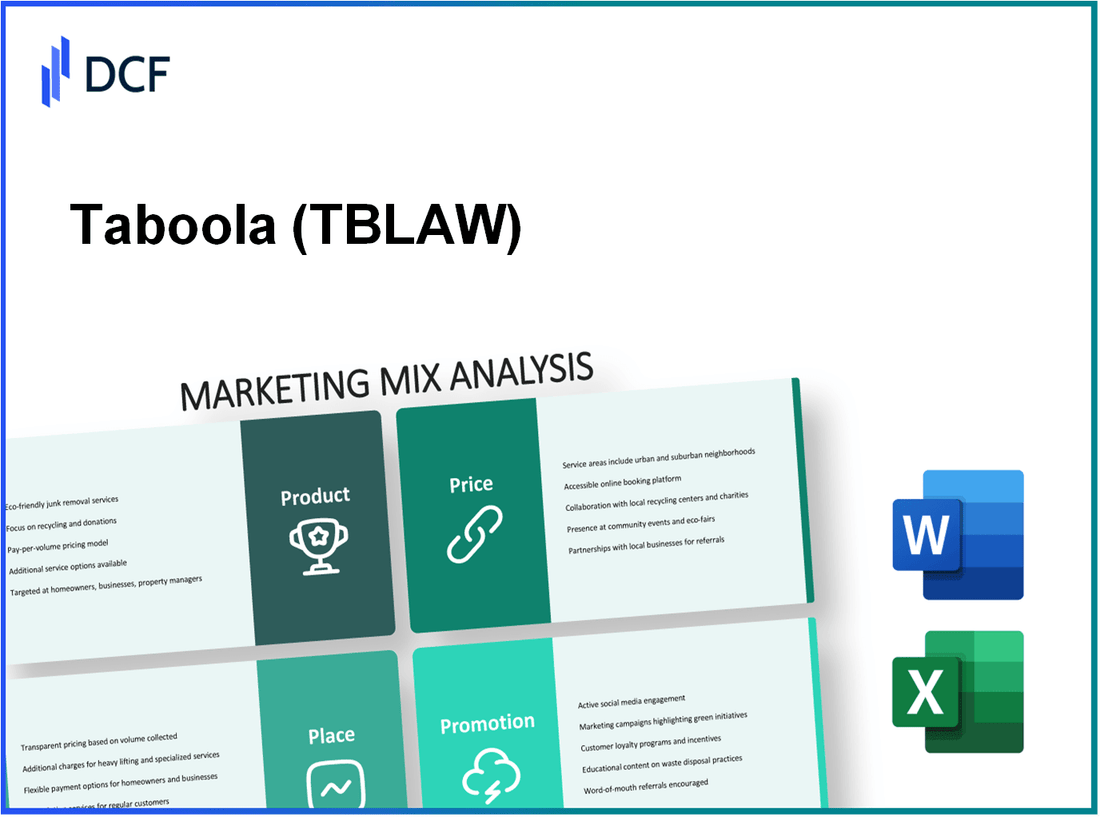
In the dynamic realm of digital marketing, understanding the four P's—Product, Place, Promotion, and Price—can unveil the secrets behind successful platforms like Taboola.com, Ltd. As a leading native advertising powerhouse, Taboola intertwines personalized content discovery with strategic ad placements to captivate global audiences. Curious about how they navigate the intricacies of pricing while maximizing visibility through innovative promotions? Dive in as we unravel the marketing mix that propels Taboola to the forefront of the industry!
Taboola.com, Ltd. - Marketing Mix: Product
Taboola.com, Ltd. operates as a native advertising platform that specializes in content discovery and recommendation. The company was founded in 2007 and has since evolved into a leading player in the online advertising landscape. ### Native Advertising Platform Taboola's primary product is its native advertising platform, which allows brands to promote their content seamlessly within the user experience of various digital environments. In the third quarter of 2023, Taboola reported revenue of approximately $206 million, showing a year-over-year increase of 20%. ### Offers Content Recommendations The platform provides content recommendations tailored to users' interests and behaviors, which are determined through complex algorithms analyzing user engagement data. As of Q2 2023, Taboola's algorithms processed over 500 billion engagement events monthly, significantly enhancing the relevance of the content recommended to users. ### Provides Personalized Content Discovery Taboola’s personalized content discovery feature is a core aspect of its value proposition. By leveraging machine learning, Taboola is able to deliver personalized content suggestions with an average click-through rate (CTR) of 1.5% in Q3 2023, outperforming industry standards for online ads, which is typically around 0.5% to 1%. ### Facilitates Targeted Ad Placements The platform facilitates targeted ad placements by utilizing first-party data from both advertisers and publishers. As of October 2023, Taboola had partnerships with over 9,000 publishers globally, including high-profile names like USA Today and The Independent, ensuring expansive reach for targeted ad placements. ### Supports Video and Display Advertising Taboola has expanded its offerings to include video advertising as part of its content distribution strategy. In Q3 2023, video ads accounted for approximately 25% of Taboola's total ad revenue, reflecting a growing trend in digital advertising where video content is increasingly favored by consumers. ### Integrates with Publisher Websites Taboola integrates directly with publisher websites to enhance content visibility and engagement. As of late 2023, it was reported that Taboola's integration could be found on over 1.4 billion unique devices worldwide. The company’s platform allows publishers to monetize their content through native ads, generating a reported increase in ad revenue of up to 20% for their partner sites.| Feature | Data/Statistics | Notes |
|---|---|---|
| Revenue Q3 2023 | $206 million | 20% year-over-year growth |
| Monthly Engagement Events | 500 billion | For personalized content recommendations |
| Average Click-Through Rate (CTR) | 1.5% | Higher than the industry average of 0.5-1% |
| Current Publisher Partnerships | 9,000+ | Includes major publishers like USA Today |
| Video Ad Revenue Q3 2023 | 25% of total ad revenue | Indicates rising preference for video content |
| Unique Devices Served | 1.4 billion | Global reach through publisher integrations |
Taboola.com, Ltd. - Marketing Mix: Place
Taboola.com, Ltd. operates globally with a strong digital presence, enabling access to its content recommendation services across multiple regions. The platform partners with over 9,000 publishers worldwide, boasting a reach of approximately 1.4 billion unique monthly users as of Q3 2023. The primary distribution channel for Taboola is its online platform, which is accessible via web browsers and mobile devices. The company has experienced a consistent year-on-year revenue growth, reporting $1.1 billion in total revenue for the fiscal year 2022, an increase from $850 million in 2021. To enhance its integration and distribution capabilities, Taboola utilizes APIs, allowing publishers to seamlessly embed Taboola's content recommendations into their websites and apps. This approach facilitates real-time data retrieval and content delivery, optimizing user engagement and ad performance. Taboola maintains a significant presence in various global markets, including the United States, Europe, and Asia. The breakdown of active publishers and traffic distribution is as follows:| Region | Active Publishers | Traffic Share (%) |
|---|---|---|
| North America | 3,200 | 55 |
| Europe | 4,000 | 30 |
| Asia | 1,800 | 15 |
Taboola.com, Ltd. - Marketing Mix: Promotion
Taboola engages in comprehensive digital marketing campaigns to bolster its reach and communicate the value of its content discovery platform. In 2022, Taboola reported a $1.078 billion revenue, significantly attributed to investments in digital advertising strategies, including programmatic advertising and targeted content recommendations.| Year | Revenue ($ Billion) | Digital Marketing Spend ($ Million) | Growth Rate (%) |
|---|---|---|---|
| 2020 | 1.035 | 150 | 22 |
| 2021 | 1.049 | 175 | 14 |
| 2022 | 1.078 | 200 | 2.8 |
Taboola.com, Ltd. - Marketing Mix: Price
Taboola employs a cost-per-click (CPC) pricing model as its primary payment structure. Advertisers pay for each click on their content, which provides a direct link between payment and audience engagement. According to various estimates, Taboola's average CPC ranges from $0.10 to $1.00, influenced by factors such as the industry, competition, and targeting options. Taboola offers flexible budgeting options for its users, allowing businesses to set daily or campaign budgets that can be adjusted based on performance and spending capacity. Advertisers can typically choose budgets ranging from as low as $100 to high-end investments exceeding $50,000 per month, enabling businesses of all sizes to participate in the platform. For larger spenders, Taboola provides volume discounts. As per the data reported in recent financial disclosures, advertisers who exceed a specified spending threshold (often around $10,000/month) can receive discounts up to 30% on their CPC rates, creating significant cost advantages for high-volume ad buyers. Taboola emphasizes transparent pricing. Advertisers receive performance reports that detail costs, click-through rates, engagement metrics, and overall return on investment, which are crucial for assessing the effectiveness of ad spend. An example of this transparency is seen in typical monthly reports where an advertiser might see detailed breakdowns of costs per campaign, with metrics such as:| Campaign Name | Total Spend ($) | Clicks | CPC ($) | CTR (%) |
|---|---|---|---|---|
| Campaign A | 2,500 | 2,500 | 1.00 | 2.5 |
| Campaign B | 1,500 | 1,500 | 1.00 | 3.0 |
| Campaign C | 5,000 | 2,000 | 2.50 | 1.8 |
In summary, Taboola.com, Ltd. exemplifies a sophisticated marketing mix that artfully weaves together an innovative product offering, a robust global presence, dynamic promotional strategies, and a flexible pricing model. By focusing on native advertising and personalized content discovery, it not only enhances user engagement but also drives substantial value for publishers and advertisers alike. As the digital landscape continues to evolve, Taboola's commitment to tailored solutions positions it as a pivotal player in the advertising space, ensuring that both brands and consumers find the content that resonates with them most.
Disclaimer
All information, articles, and product details provided on this website are for general informational and educational purposes only. We do not claim any ownership over, nor do we intend to infringe upon, any trademarks, copyrights, logos, brand names, or other intellectual property mentioned or depicted on this site. Such intellectual property remains the property of its respective owners, and any references here are made solely for identification or informational purposes, without implying any affiliation, endorsement, or partnership.
We make no representations or warranties, express or implied, regarding the accuracy, completeness, or suitability of any content or products presented. Nothing on this website should be construed as legal, tax, investment, financial, medical, or other professional advice. In addition, no part of this site—including articles or product references—constitutes a solicitation, recommendation, endorsement, advertisement, or offer to buy or sell any securities, franchises, or other financial instruments, particularly in jurisdictions where such activity would be unlawful.
All content is of a general nature and may not address the specific circumstances of any individual or entity. It is not a substitute for professional advice or services. Any actions you take based on the information provided here are strictly at your own risk. You accept full responsibility for any decisions or outcomes arising from your use of this website and agree to release us from any liability in connection with your use of, or reliance upon, the content or products found herein.