
|
TRACON Pharmaceuticals, Inc. (TCON) DCF Valuation |
Fully Editable: Tailor To Your Needs In Excel Or Sheets
Professional Design: Trusted, Industry-Standard Templates
Investor-Approved Valuation Models
MAC/PC Compatible, Fully Unlocked
No Expertise Is Needed; Easy To Follow
TRACON Pharmaceuticals, Inc. (TCON) Bundle
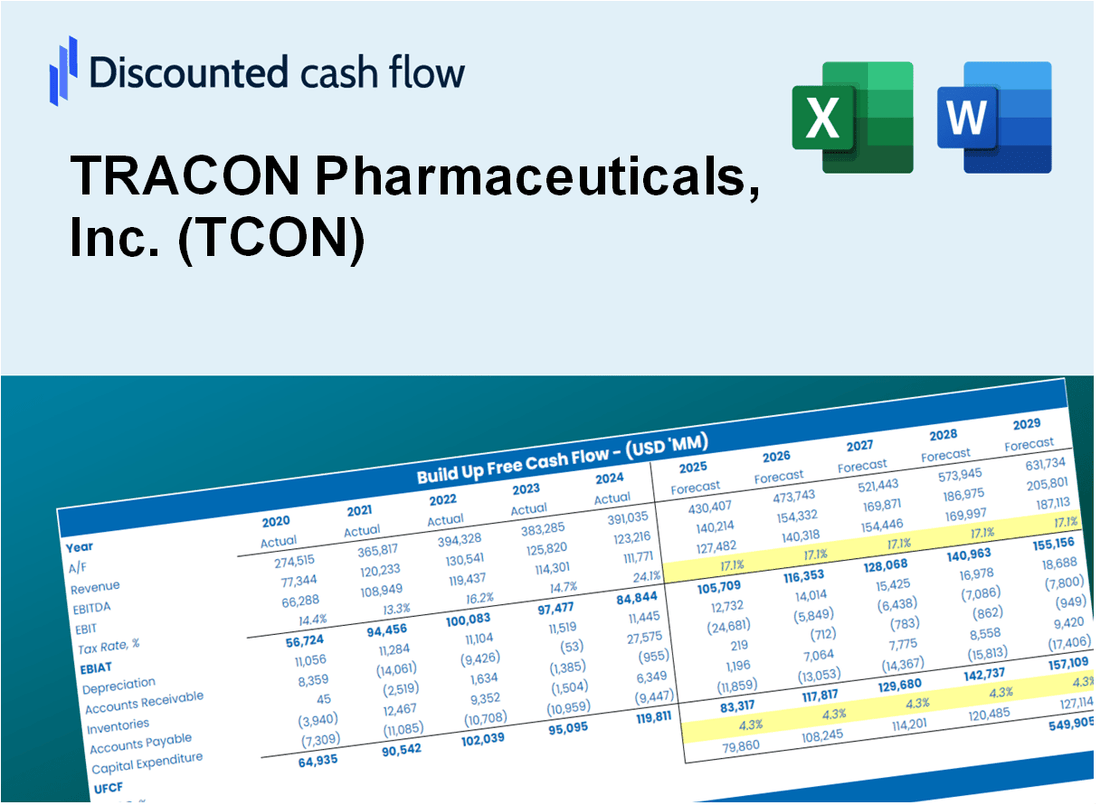
Discover the true potential of TRACON Pharmaceuticals, Inc. (TCON) with our advanced DCF Calculator! Adjust key assumptions, explore various scenarios, and evaluate how fluctuations affect the valuation of TRACON Pharmaceuticals, Inc. (TCON) – all within one comprehensive Excel template.
What You Will Get
- Real TCON Financial Data: Pre-filled with TRACON Pharmaceuticals' historical and projected data for precise analysis.
- Fully Editable Template: Modify key inputs like revenue growth, WACC, and EBITDA % with ease.
- Automatic Calculations: See TRACON Pharmaceuticals' intrinsic value update instantly based on your changes.
- Professional Valuation Tool: Designed for investors, analysts, and consultants seeking accurate DCF results.
- User-Friendly Design: Simple structure and clear instructions for all experience levels.
Key Features
- Real-Life TCON Data: Pre-filled with TRACON Pharmaceuticals’ historical financials and future projections.
- Fully Customizable Inputs: Modify revenue growth, margins, WACC, tax rates, and capital expenditures to suit your analysis.
- Dynamic Valuation Model: Automatically updates Net Present Value (NPV) and intrinsic value based on your customized inputs.
- Scenario Testing: Develop multiple forecasting scenarios to evaluate various valuation outcomes.
- User-Friendly Design: Intuitive and structured, catering to both professionals and newcomers.
How It Works
- Step 1: Download the Excel file.
- Step 2: Review pre-entered TRACON Pharmaceuticals data (historical and projected).
- Step 3: Adjust key assumptions (yellow cells) based on your analysis.
- Step 4: View automatic recalculations for TRACON Pharmaceuticals’ intrinsic value.
- Step 5: Use the outputs for investment decisions or reporting.
Why Choose This Calculator for TRACON Pharmaceuticals, Inc. (TCON)?
- All-in-One Solution: Combines DCF, WACC, and financial ratio analyses specifically tailored for TCON.
- Flexible Inputs: Modify yellow-highlighted fields to explore different financial scenarios.
- In-Depth Analysis: Automatically computes TRACON's intrinsic value and Net Present Value.
- Preloaded Information: Historical and projected data provide a solid foundation for analysis.
- Expert-Level Tool: Perfect for financial analysts, investors, and business advisors focusing on TCON.
Who Should Use This Product?
- Investors: Assess TRACON Pharmaceuticals, Inc.’s (TCON) fair value to inform investment strategies.
- CFOs: Utilize an advanced DCF model for accurate financial reporting and analysis.
- Consultants: Easily customize the template for client valuation reports related to TRACON Pharmaceuticals.
- Entrepreneurs: Learn from the financial modeling practices of leading biotech firms.
- Educators: Employ this tool to illustrate valuation techniques in academic settings.
What the Template Contains
- Historical Data: Includes TRACON Pharmaceuticals’ past financials and baseline forecasts.
- DCF and Levered DCF Models: Detailed templates to calculate TRACON Pharmaceuticals’ intrinsic value.
- WACC Sheet: Pre-built calculations for Weighted Average Cost of Capital.
- Editable Inputs: Modify key drivers like growth rates, EBITDA %, and CAPEX assumptions.
- Quarterly and Annual Statements: A complete breakdown of TRACON Pharmaceuticals’ financials.
- Interactive Dashboard: Visualize valuation results and projections dynamically.
Disclaimer
All information, articles, and product details provided on this website are for general informational and educational purposes only. We do not claim any ownership over, nor do we intend to infringe upon, any trademarks, copyrights, logos, brand names, or other intellectual property mentioned or depicted on this site. Such intellectual property remains the property of its respective owners, and any references here are made solely for identification or informational purposes, without implying any affiliation, endorsement, or partnership.
We make no representations or warranties, express or implied, regarding the accuracy, completeness, or suitability of any content or products presented. Nothing on this website should be construed as legal, tax, investment, financial, medical, or other professional advice. In addition, no part of this site—including articles or product references—constitutes a solicitation, recommendation, endorsement, advertisement, or offer to buy or sell any securities, franchises, or other financial instruments, particularly in jurisdictions where such activity would be unlawful.
All content is of a general nature and may not address the specific circumstances of any individual or entity. It is not a substitute for professional advice or services. Any actions you take based on the information provided here are strictly at your own risk. You accept full responsibility for any decisions or outcomes arising from your use of this website and agree to release us from any liability in connection with your use of, or reliance upon, the content or products found herein.