
|
TFS Financial Corporation (TFSL): PESTLE Analysis [Nov-2025 Updated] |
Fully Editable: Tailor To Your Needs In Excel Or Sheets
Professional Design: Trusted, Industry-Standard Templates
Investor-Approved Valuation Models
MAC/PC Compatible, Fully Unlocked
No Expertise Is Needed; Easy To Follow
TFS Financial Corporation (TFSL) Bundle
You're looking at TFS Financial Corporation (TFSL) after a strong 2025 fiscal year-they hit a record net income of $91.0 million, up 14.3% year-over-year, with total assets reaching $17.46 billion. That growth is solid, but the future isn't just about the balance sheet; it's about navigating the political shift toward deregulation, managing the $15.66 billion real estate loan portfolio's climate exposure in coastal Florida, and accelerating digital transformation to defend the expanded 1.76% Net Interest Margin (NIM) against digitally native competitors. This PESTLE analysis cuts straight to the risks and opportunities shaping the company's strategy, giving you a clear map for your next decision.
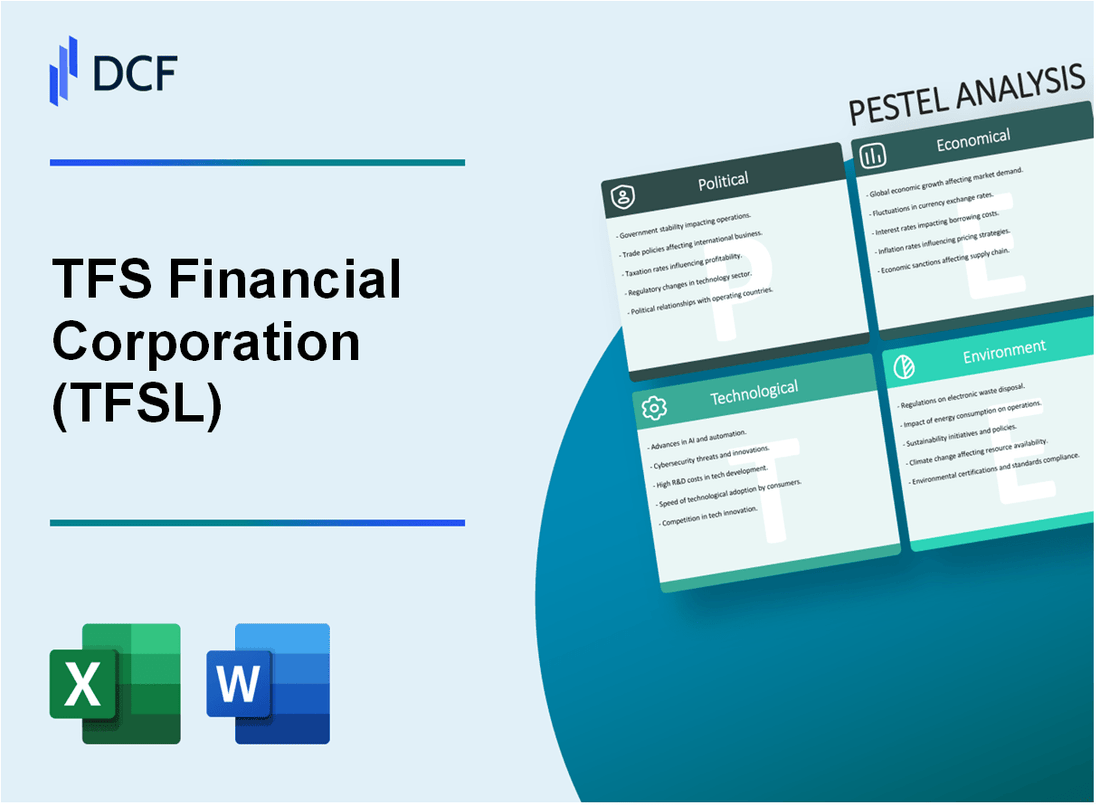
TFS Financial Corporation (TFSL) - PESTLE Analysis: Political factors
Federal regulatory environment is shifting toward a more deregulatory stance under the new administration.
The political climate in 2025 is defintely leaning toward regulatory tailoring, which is a significant tailwind for community banks like TFS Financial Corporation. The Office of the Comptroller of the Currency (OCC) has been clear about reducing supervisory burden for institutions with assets up to $30 billion. This shift is driven by the belief that smaller banks play a vital role in local economies and should not be overwhelmed by compliance requirements designed for massive, global institutions.
This means a move away from prescriptive, one-size-fits-all rules to a more risk-based approach. The OCC's new guidance, effective January 1, 2026, eliminates fixed examination requirements, allowing examiners to focus on material financial risks specific to the bank. This is a practical change that frees up management time and resources. Less time preparing for rigid exams means more time for lending.
Reduced supervisory scrutiny from federal agencies like the OCC could lower compliance costs for community banks.
The tangible benefit of this tailored supervision is a reduction in compliance costs, which directly boosts the bottom line. For TFS Financial Corporation, with total consolidated assets of $17.46 billion at September 30, 2025, the new OCC bulletins provide immediate relief in several complex areas.
For example, the OCC clarified that community banks are not required to conduct annual model validations for risk management, allowing the company to tailor its practices to its actual risk profile. Also, the oversight of retail non-deposit investment products will be streamlined, using only core assessment standards instead of the previously detailed handbook. This is a clear, actionable opportunity to reallocate compliance spending.
Here's the quick math on the regulatory relief areas announced in late 2025:
| Regulatory Change Area | Impact on TFS Financial Corporation |
|---|---|
| Examination Frequency/Scope | Elimination of fixed requirements, moving to risk-based reviews (effective Jan 1, 2026). |
| Model Risk Management | No longer mandatory annual model validations, reducing resource drain. |
| Retail Non-Deposit Investment Products | Streamlined examination using only core assessment standards. |
| Community Bank Licensing | Proposed rule to expand expedited licensing eligibility for corporate activities. |
Shifts in US trade policy and tariffs, while indirect, can create economic uncertainty that affects mortgage demand.
While TFS Financial Corporation is a domestic mortgage lender, it's not immune to global political decisions like US trade policy. New or proposed tariffs, such as a potential 10% global tariff on imports, create economic uncertainty by raising inflation expectations. This inflationary pressure can push long-term bond yields higher, which directly translates to increased mortgage rates.
Higher mortgage rates cool the housing market and suppress demand for new mortgages, which is the company's core product. Mortgage industry forecasts for the 30-year fixed-rate mortgage rate at the end of 2025 hover between 6.3% and 6.6%, a range that is highly sensitive to trade-related inflation. This political uncertainty is a major headwind for loan origination volume.
The company must navigate the Federal Reserve's Regulation MM, which governs the mutual holding company's dividend waivers.
A unique political-regulatory factor for TFS Financial Corporation is the annual process required by the Federal Reserve's Regulation MM (12 C.F.R. Part 239). This regulation governs the dividend waiver by the majority owner, Third Federal Savings and Loan Association of Cleveland, MHC (MHC), which holds approximately 81% of the common stock.
The waiver is crucial because it allows the company to retain capital, which supports its robust financial stability metrics, like a Tier 1 leverage ratio of 10.89% and a total capital ratio of 19.24% as of September 30, 2024. The political risk here is the annual need for member approval and the Federal Reserve Bank of Cleveland's non-objection.
The process for the current period is complete, but it's a constant political factor:
- MHC member approval was obtained on July 8, 2025.
- The approved maximum waiver amount is up to $1.13 per share for the twelve months through July 8, 2026.
- The MHC has already waived the quarterly dividend of $0.2825 per share for the quarter ending September 30, 2025.
Any future objection from the Federal Reserve or a failure to secure member approval would force the MHC to take its dividend, resulting in a significant cash outflow and a potential reduction of retained earnings, which would be a major capital event. It's a recurring, high-stakes political hurdle.
TFS Financial Corporation (TFSL) - PESTLE Analysis: Economic factors
The economic environment for TFS Financial Corporation (TFSL) in fiscal year 2025 was a story of a mortgage-focused bank successfully navigating a high-rate, yet stable, US economy. The direct takeaway is that while the broader banking sector faces net interest margin (NIM) pressure, TFS Financial Corporation's focus on retail deposits and higher-yielding loans allowed it to achieve record earnings.
Macroeconomic Headwinds and Tailwinds
You need to look at the two sides of the coin here. On one hand, the US economic outlook for late 2025 suggests that net interest income (NII) for the overall banking industry will likely decline as the cost of deposits stays elevated, even if the Federal Reserve eases rates slightly. This is a macro headwind for any financial institution. But for TFS Financial Corporation, the tailwind was their ability to manage their balance sheet effectively. They reported record net income of $91.0 million for fiscal year 2025, which is a significant 14.3% increase year-over-year. That's defintely a strong performance in a competitive environment.
The key to their success was the strategic shift in their loan portfolio. They are systematically replacing older, lower-rate residential mortgage loans with newer, higher-yielding products, which is crucial for a thrift institution. This action directly led to the full-year net interest margin (NIM) expanding to 1.76%, up from 1.69% in the prior year.
Funding Stability and Balance Sheet Growth
A major strength for TFS Financial Corporation is its stable funding base, which insulates it from the volatility of wholesale markets. Their retail deposit base grew by a substantial $567 million in fiscal year 2025. This is a lower-cost, stickier source of funding compared to relying on brokered deposits or Federal Home Loan Bank (FHLB) advances. Honestly, a healthy retail deposit base is the bedrock of a resilient bank in a rising-rate environment.
Here's the quick math on their balance sheet: total assets reached $17.46 billion as of September 30, 2025. This represents modest, but healthy, balance sheet growth, fueled primarily by an increase in loans held for investment. Specifically, their home equity loans and lines of credit surged by $927 million, reaching $4.81 billion. This focus on home equity is smart, as these products typically carry higher yields and shorter durations than traditional 30-year mortgages, which helps boost the NIM.
| Key Financial Metric (FY 2025) | Value/Amount | Year-over-Year Change |
|---|---|---|
| Net Income | $91.0 million | Increase of 14.3% |
| Total Assets (Sep 30, 2025) | $17.46 billion | Up 2.1% |
| Net Interest Margin (NIM) | 1.76% | Up 7 basis points |
| Retail Deposit Growth | $567 million | Significant growth |
| Net Interest Income (NII) | $292.7 million | Increase of 5.1% |
Near-Term Risks and Opportunities
The economic outlook presents both risks and opportunities for a mortgage lender like TFS Financial Corporation. While lower interest rates are expected to improve loan demand, particularly for mortgages, the increase in general consumer credit delinquencies is a point of concern. What this estimate hides is the potential for credit losses to rise, even if the overall economy avoids a deep recession. However, the company's Tier 1 capital ratio remains strong, near 11%, showing they are well-capitalized to handle a modest increase in credit losses.
The opportunities are clear, though:
- Capitalize on expected lower mortgage rates to drive higher origination volume.
- Continue the strong push into home equity lines of credit (HELOCs) for higher yield.
- Maintain the low-cost retail deposit base to keep funding costs below the industry average.
Your next step should be to look closely at the provision for credit losses, which increased in fiscal year 2025, to gauge the true credit quality trend within their loan book.
TFS Financial Corporation (TFSL) - PESTLE Analysis: Social factors
Sociological
The social landscape for TFS Financial Corporation (TFSL), operating as Third Federal Savings and Loan Association of Cleveland, is defintely anchored in its community-centric identity. This is a massive competitive advantage in a financial industry increasingly dominated by impersonal, national-scale banks. The company's core mission-helping people achieve homeownership and financial security-resonates deeply across its primary markets in Ohio and Florida.
This mission translates directly into product focus, where the company emphasizes residential mortgage and home equity loans. In fiscal year 2025, the company's total assets stood at $17.46 billion as of September 30, 2025, a figure built on this stable, community-focused lending model.
Branch Network and Customer Preference
While digital banking is the norm, a significant portion of deposit growth still comes through the physical branch system, indicating a customer base that values in-person banking and local relationships. This is a critical social factor to manage. You can't just cut the branch count and expect the same loyalty.
As of late 2025, Third Federal operates 36 full-service branches-21 in Northeast Ohio and 15 in Florida-plus two lending offices in Central and Southern Ohio. This physical presence supports the strong retail deposit performance. For the fiscal year ended September 30, 2025, total deposits grew by $251.9 million to $10.45 billion.
Here's the quick math on where that growth came from:
- Retail certificates of deposit (CDs) increased by a substantial $768.9 million in FY 2025.
- This retail growth was partially offset by decreases in other accounts, but the retail CD surge shows a strong preference for in-person, rate-competitive products.
- Overall retail deposits stayed strong, showing a $567 million increase in fiscal year 2025.
Community Investment and Brand Loyalty
The Third Federal Foundation is a key pillar of the company's social contract with its communities. The foundation has contributed over $60 million to community programs since 2007, enhancing local brand loyalty and reputation, especially in the greater Cleveland and Akron areas of Ohio, and select Florida markets. This isn't just charity; it's a long-term investment in the company's operating environment.
In the most recent reporting period, the Foundation's commitment remained strong.
| Foundation Metric | Value (FYE 12/2024) | Social Impact |
|---|---|---|
| Total Expenses | $4,189,219 | Indicates significant operational scale for community work. |
| Total Grants Paid | $3,469,700 | Direct capital injection into non-profit partners. |
This focus on community stability, affordable housing, and financial literacy directly reinforces their core mission.
The Mutual Holding Company (MHC) Structure
The Mutual Holding Company (MHC) structure creates a unique member-owner culture, which is defintely a competitive differentiator against traditional stock-owned banks. The MHC, Third Federal Savings and Loan Association of Cleveland, MHC, owns approximately 81% of TFS Financial Corporation's outstanding common stock.
This structure requires the MHC to annually seek approval from its members (depositors and certain loan customers) to waive its right to receive dividends. For the 12 months subsequent to the July 2025 approval, the waiver covered up to $1.13 per share. This practice allows capital to be retained within the company, supporting the mission of competitive rates and outstanding service for its customers, who are also the MHC members. It's a very visible way to show that customer interests are prioritized over maximum shareholder return.
TFS Financial Corporation (TFSL) - PESTLE Analysis: Technological factors
Leadership is prioritizing digital transformation and operational efficiency to reduce the expense-to-asset ratio.
You can see clearly that management is focused on efficiency, a necessary move for a thrift institution competing against larger national banks. The core challenge is leveraging technology to drive down the cost of doing business, which is measured by the expense-to-asset ratio. For the fiscal year ended September 30, 2025, TFS Financial Corporation reported total non-interest expense of $204.3 million against total assets of $17.46 billion.
Here's the quick math: that translates to an expense-to-asset ratio of approximately 1.17%. This ratio is relatively high for a large, efficient bank, signaling that the company must invest in process automation to compete on price and scale. The good news is that the increase in non-interest expense for the year included an extra $1.1 million in office property, equipment, and software expenses, a small but defintely visible step toward modernizing the infrastructure.
The company must invest heavily in IT and process automation to compete with national banks and FinTechs in mortgage origination.
The mortgage market is a technology arms race, and TFS Financial Corporation's traditional, relationship-based model is vulnerable to digitally native competitors like Rocket Mortgage or major national banks. These rivals use sophisticated Loan Origination Systems (LOS) and Artificial Intelligence (AI) for instant underwriting, which dramatically cuts the time and cost to close a loan. In fiscal year 2025, the company originated and acquired a substantial volume of loans, including $1.19 billion in residential mortgage loans and $2.52 billion in home equity loans and lines of credit.
To protect this volume, the company needs to deploy Robotic Process Automation (RPA) in the back office. The broader North American financial automation market is projected to reach $40.64 billion in 2025, with 90% of financial institutions expected to utilize RPA for tasks like loan processing to boost operational efficiency. Without this investment, the cost per loan origination will remain uncompetitive, squeezing margins.
Mobile and online banking services are necessary table stakes for deposit retention against digitally native competitors.
Digital channels are no longer a convenience; they are the primary interface for deposit gathering, especially among younger customers. While TFS Financial Corporation saw a healthy increase in retail deposits of $567 million for fiscal year 2025, a significant portion of this growth was in Certificates of Deposit (CDs), which are rate-sensitive and less reliant on daily digital interaction. The real risk lies in retaining core checking and money market accounts.
The current digital offering is a clear liability. As of late 2025, the Third Federal Savings and Loan Association mobile app is described by users as 'basic and functional' but critically lacks modern, expected features. The most glaring omission is the absence of a direct integration with Zelle, the popular peer-to-peer payment network. This single feature gap makes the bank inconvenient for daily transactions, increasing the churn risk for digitally active customers who can easily move their primary checking account to a competitor.
| Feature | TFS Financial (Third Federal) (2025) | National Bank/FinTech Competitor (2025) |
|---|---|---|
| P2P Payments | Basic transfers, no Zelle integration | Instant Zelle transfers (Standard) |
| Core App Functionality | Review balances, transfer funds, view cleared checks | Real-time personalized financial advice, budgeting tools, AI-driven fraud alerts |
| Loan Application | Primarily branch/phone-driven process (Implied) | Fully digital, instant pre-approval, e-closing options |
Cybersecurity risk remains a top priority, as any breach would immediately compromise customer trust and regulatory standing.
The financial sector faces an escalating threat landscape, and TFS Financial Corporation's public filings explicitly list 'cyber-attacks, computer viruses and other technological risks' as a material risk factor. The shift to digital channels and the reliance on third-party vendors for new technology (a common strategy for smaller banks) increases the attack surface.
The industry is grappling with new threats in 2025, including surging fraud and scams enabled by generative Artificial Intelligence (GenAI) and sophisticated attacks on the supply chain. A breach of customer data, even if quickly contained, would be catastrophic for a company whose brand is built on trust and stability. This risk requires continuous, non-negotiable investment in security measures like advanced biometrics and behavioral biometrics for authentication.
- Increase investment in fraud prevention, especially for real-time payments.
- Strengthen supply chain security, as third-party attacks are a top 2025 threat.
- Implement advanced multi-factor authentication beyond simple passwords.
Finance: Allocate an immediate $5 million to a dedicated digital security and compliance upgrade for the next fiscal year.
TFS Financial Corporation (TFSL) - PESTLE Analysis: Legal factors
The legal landscape for TFS Financial Corporation is primarily defined by stringent federal capital requirements and a complex web of consumer protection laws across its lending footprint. The direct takeaway is that the company's strong capital position significantly de-risks its regulatory profile, but the rising cost of multi-state compliance and an evolving Community Reinvestment Act (CRA) framework demand constant attention.
Capital Adequacy and Basel III Compliance
TFS Financial Corporation operates under the standardized approach of the Basel III capital framework for U.S. banking organizations, which is the key regulatory standard for financial strength. Maintaining capital ratios well above the mandatory minimums is a core strategic priority, and the company has consistently exceeded the 'well capitalized' thresholds set by regulators like the Federal Deposit Insurance Corporation (FDIC) and the Office of the Comptroller of the Currency (OCC).
As of the fiscal year ended September 30, 2025, the company's capital ratios demonstrate a substantial buffer against unexpected losses. This high capitalization offers a competitive advantage and provides operational flexibility, especially amid broader market volatility.
| Capital Ratio Metric | TFS Financial Corporation Ratio (FY 2025) | Regulatory 'Well Capitalized' Minimum | Capital Buffer (TFSL vs. Minimum) |
|---|---|---|---|
| Common Equity Tier 1 (CET1) Ratio | 17.60% | 6.50% | 11.10 percentage points |
| Tier 1 Risk-Based Capital Ratio | 17.60% | 8.00% | 9.60 percentage points |
| Total Risk-Based Capital Ratio | 18.46% | 10.00% | 8.46 percentage points |
| Tier 1 Leverage Ratio (Non-Risk Weighted) | 10.76% | 5.00% | 5.76 percentage points |
Here's the quick math: The CET1 ratio of 17.60% is over two and a half times the 6.50% minimum for a well-capitalized institution, which is defintely a source of strength.
Multi-State Compliance and Rising Legal Costs
The company's broad geographic reach, lending in 28 states and the District of Columbia, subjects it to a patchwork of state-specific consumer protection, foreclosure, and mortgage servicing laws. This complexity drives up non-interest expenses, particularly in legal and professional services, as the company must maintain compliance across numerous jurisdictions.
The financial reports for the fiscal year ended September 30, 2025, show that total non-interest expense was $204.3 million. A breakdown of this cost reveals the increasing burden of regulatory overhead:
- Total non-interest expense for the fiscal year was $204.3 million.
- Legal and professional consulting expenses increased by $0.6 million compared to the prior fiscal year, reflecting ongoing costs to navigate regulatory changes and multi-state compliance.
Navigating 28 different sets of mortgage servicing rules is expensive.
Community Reinvestment Act (CRA) and Regulatory Fluidity
Compliance with the Community Reinvestment Act (CRA) is a critical legal factor, given the mission of Third Federal Savings and Loan Association of Cleveland to serve low- and moderate-income (LMI) communities, particularly in its core markets of Ohio and Florida. The regulatory environment around CRA is currently in a state of flux, which creates compliance uncertainty.
The primary risk here is the potential for new compliance obligations or re-evaluation of assessment areas as regulators work to finalize a new framework. For example, the agencies proposed to rescind the 2023 CRA Final Rule and revert to the 1995 regulations with updated asset-size thresholds for 2025, which means the rules of the game are still shifting. The company must ensure its 21 full-service branches in Northeast Ohio and 15 full-service branches throughout Florida continue to meet LMI lending, investment, and service tests under the final, yet-to-be-determined, CRA rules.
Finance: Track the final CRA rule publication date and model the impact on lending distribution targets within 30 days of release.
TFS Financial Corporation (TFSL) - PESTLE Analysis: Environmental factors
The environmental factors for TFS Financial Corporation are no longer just about compliance; they are a direct, measurable credit risk, particularly given the geographic concentration of its loan book in Florida and Ohio. This exposure to both physical and transition risks requires a proactive, data-driven strategy to manage your $15.66 billion loan portfolio as of the September 30, 2025, fiscal year-end.
The $15.66 billion real estate loan portfolio is exposed to physical climate risks, especially in coastal Florida (hurricanes) and Ohio (flooding).
Your exposure to physical climate risk is most acute in Florida, where TFS Financial Corporation maintains 16 full-service branches. The escalating cost of homeowners insurance-a direct result of increasing hurricane frequency and severity-is a clear driver of mortgage delinquency risk.
Honestly, the insurance crisis is the new foreclosure trigger in Florida.
For context, a recent study tied a mere $500 spike in annual insurance premiums to a 20% higher mortgage delinquency rate for borrowers. The average annual homeowners insurance premium in Florida is already over $5,700, which is about $3,350 above the national average. Coastal areas like Fort Lauderdale face even steeper averages, around $8,347 annually. This added burden directly erodes a borrower's capacity to service the $10.80 billion in residential core mortgage loans on your books.
In Ohio, the risk profile shifts from wind to water. The severity of heavy precipitation events is increasing, as evidenced by the historic flooding in the Ohio Valley between April 3rd and 6th, 2025. This event highlighted a major gap in risk modeling:
- A June 2025 report found that 32% of the 21,997 flooded properties were in FEMA's low-risk X Zones.
- This means properties traditionally considered safe are now vulnerable, exposing loans that may not carry mandatory flood insurance.
- The U.S. Small Business Administration (SBA) had an application deadline of November 12, 2025, for physical damage loans related to a separate July 2025 flood event in Fairfield County, Ohio, underscoring the near-term and recurring nature of this risk.
The city of Cleveland, the company's headquarters, has a 2025 Climate Action Plan focused on resiliency to heavy precipitation and extreme heat.
As a major employer headquartered in Cleveland, TFS Financial Corporation is operating within a jurisdiction that is actively mapping and mitigating climate hazards. The city's updated 2025 Climate Action Plan (CAP) and Municipal Action Plan (MAP) explicitly identify extreme heat and heavy precipitation & severe storms as key threats. The plan aims to achieve net-zero emissions by 2050.
This local government focus creates both a mandate and an opportunity for the company to align its own operational and lending practices with resilience goals. For example, the city is prioritizing green infrastructure projects and creating new development metrics that emphasize resilience. This is a clear signal for where future local investment and property value stability will be concentrated.
| Cleveland 2025 Climate Hazard Focus | Impact on TFS Financial Corporation | Actionable Insight |
|---|---|---|
| Heavy Precipitation & Severe Storms | Increased flood risk in low-risk (X) zones, leading to uninsured property damage and potential loan default. | Integrate non-FEMA flood models (e.g., First Street) into underwriting for Ohio properties immediately. |
| Extreme Heat | Increased energy costs for older, inefficient properties, straining borrower liquidity and raising delinquency risk. | Offer Home Equity Lines of Credit (HELOCs) specifically for energy-efficiency retrofits in the Cleveland area. |
| Net-Zero by 2050 Goal | Future municipal and state policies will favor 'green' buildings, potentially devaluing older, less-efficient collateral. | Start tracking the Energy Star or HERS rating for all new loan originations to assess future transition risk. |
As a mortgage lender, TFSL is indirectly exposed to transition risk as new energy efficiency standards may devalue older, less green real estate assets.
Beyond the immediate physical damage from storms, you face a transition risk-the financial risk tied to shifting to a low-carbon economy. The federal government is moving the goalposts on what qualifies as a standard, insurable asset. Specifically, the U.S. Department of Housing and Urban Development (HUD) adopted the 2021 International Energy Conservation Code (IECC).
This is a big deal because FHA-insured single-family programs are required to implement these new standards by November 2025. Homes built to the 2021 IECC are 34.3% more energy-efficient than those built to the old 2009 standards. The older, less-efficient homes that make up a portion of your $10.80 billion residential core mortgage portfolio will likely see a decline in market value, or at least a widening gap in value compared to newer, greener homes, due to higher operating costs for the homeowner. This devaluation of collateral increases your loan-to-value (LTV) risk over time. You defintely need to model the depreciation curve for pre-2021 code homes.
Disclaimer
All information, articles, and product details provided on this website are for general informational and educational purposes only. We do not claim any ownership over, nor do we intend to infringe upon, any trademarks, copyrights, logos, brand names, or other intellectual property mentioned or depicted on this site. Such intellectual property remains the property of its respective owners, and any references here are made solely for identification or informational purposes, without implying any affiliation, endorsement, or partnership.
We make no representations or warranties, express or implied, regarding the accuracy, completeness, or suitability of any content or products presented. Nothing on this website should be construed as legal, tax, investment, financial, medical, or other professional advice. In addition, no part of this site—including articles or product references—constitutes a solicitation, recommendation, endorsement, advertisement, or offer to buy or sell any securities, franchises, or other financial instruments, particularly in jurisdictions where such activity would be unlawful.
All content is of a general nature and may not address the specific circumstances of any individual or entity. It is not a substitute for professional advice or services. Any actions you take based on the information provided here are strictly at your own risk. You accept full responsibility for any decisions or outcomes arising from your use of this website and agree to release us from any liability in connection with your use of, or reliance upon, the content or products found herein.