
|
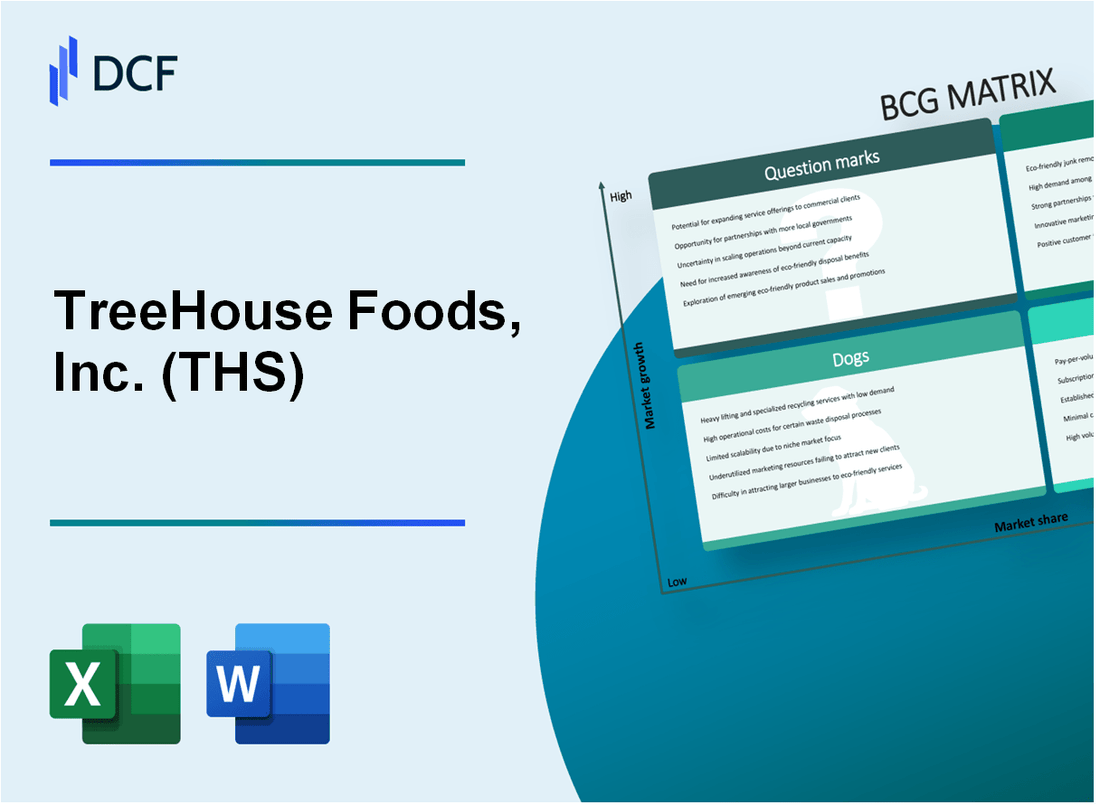
TreeHouse Foods, Inc. (THS): BCG Matrix [Dec-2025 Updated] |
Fully Editable: Tailor To Your Needs In Excel Or Sheets
Professional Design: Trusted, Industry-Standard Templates
Investor-Approved Valuation Models
MAC/PC Compatible, Fully Unlocked
No Expertise Is Needed; Easy To Follow
TreeHouse Foods, Inc. (THS) Bundle
You're looking for a clear map of TreeHouse Foods, Inc.'s portfolio, and honestly, the 2025 picture shows clear winners and clear clean-up jobs that demand your attention right now. We've mapped their business units using the four-quadrant BCG Matrix, showing exactly where the capital should defintely flow next. Think high-growth Stars like the private brand tea business, which was accretive by 4%, fighting for share in a market now at 25% dollar share, all supported by Cash Cows delivering at least $130 million in free cash flow. But we also have to address the Dogs, which recently absorbed a massive $289.7 million goodwill impairment, and the Question Marks that need that $125 million capital expenditure to reverse a 1% volume/mix decline. Dive in below to see the precise breakdown of where TreeHouse Foods, Inc. is generating cash and where it needs to invest or divest.
Background of TreeHouse Foods, Inc. (THS)
TreeHouse Foods, Inc. (THS) operates as a major manufacturer of private-label foods and beverages across North America. You'll find their products in grocery and food service channels, covering categories like crackers, broths, and beverages. The company has been actively positioning itself to benefit from the long-term trend of private brands gaining share; for instance, their categories' private brand dollar share reached nearly 25% year-to-date in 2025, up from 16% back in 2006.
Financially, the picture in late 2025 has been mixed, showing operational improvements alongside significant one-time charges. For the third quarter of 2025, TreeHouse Foods reported net sales of $840.3 million, which was essentially flat year-over-year. However, the reported net loss for that quarter was substantial at $(265.8) million, largely driven by a non-cash goodwill impairment loss of $289.7 million.
Still, underlying operational performance showed some strength. The gross profit margin improved to 18.8% in Q3 2025, up from 15.6% the prior year, thanks to insurance recoveries related to product recalls and favorable margins from the recent Harris Tea acquisition. On the other hand, sales volumes were a concern, dropping 11.6% year-on-year in Q3 2025, reflecting broader macroeconomic consumption trends and planned margin management actions.
Strategically, the company has been making big moves. TreeHouse Foods has been exiting certain areas, such as the Ready-to-drink (RTD) business, while integrating acquisitions like the private brand tea business. Most significantly for the near term, the company announced a pending acquisition by Investindustrial for a total value of $2.9 billion, leading them to withdraw forward guidance as of November 2025.
TreeHouse Foods, Inc. (THS) - BCG Matrix: Stars
The Star quadrant represents business units or products within TreeHouse Foods, Inc. (THS) that command a high market share within a market segment experiencing significant growth. These units are the current leaders and require substantial investment to maintain their competitive position and eventually transition into Cash Cows as market growth moderates.
The strategic focus areas identified as potential Stars for TreeHouse Foods, Inc. (THS) are anchored by recent acquisitions and long-term category trends favoring private label penetration.
- - Private brand tea business, acquired in early 2025, is accretive to net sales by roughly 4%.
- - Focused snacking categories like pretzels and crackers, benefiting from the long-term private label trend.
- - Non-dairy creamer and coffee segments, aligning with the strategic pivot to higher-growth beverage categories.
- - These segments are in the high-growth private label market, which reached approximately 25% dollar share in 2025.
The acquisition of Harris Tea in early January 2025 immediately positions TreeHouse Foods, Inc. (THS) in a leadership role within the private label tea space, a category aligning with the broader beverage focus. This segment is expected to contribute meaningfully to the top line, given the overall market dynamics.
| Metric | Private Brand Tea Acquisition Impact (2025 Est.) | TreeHouse Foods, Inc. (THS) Fiscal 2025 Guidance |
| Net Sales Contribution | Accretive by roughly 4% | Adjusted Net Sales expected between $3.340 billion and $3.415 billion |
| Profitability Impact | Accretive to Adjusted EBITDA | Adjusted EBITDA forecasted between $345 million and $375 million |
| Market Context | High-growth private label tea segment | Overall US private label dollar share reached 21.2% in H1 2025 |
The snacking categories, including pretzels, demonstrated strength, showing a volume/mix increase in the fourth quarter of 2024. This suggests continued momentum in these areas, which are core to the company's streamlined portfolio. The overall private label food market is seeing strong growth, with the dairy product segment holding over 25% market share, indicating high-growth potential for associated private label categories like non-dairy creamer.
The company's Q2 2025 results showed a Gross Profit as a percentage of net sales of 17.4%, reflecting the margin-accretive nature of recent strategic moves, including the tea business. For you to track the Star performance, watch for continued positive volume/mix trends in snacking and beverage categories, which should drive the company toward the higher end of its projected fiscal 2025 Adjusted EBITDA range of $345 million to $375 million.
TreeHouse Foods, Inc. (THS) - BCG Matrix: Cash Cows
You're looking at the engine room of TreeHouse Foods, Inc. (THS), the business units that consistently deliver more cash than they need to operate. These are the established private label pantry staples, the categories where TreeHouse Foods has achieved a high relative market share in mature segments. These brands don't require massive promotional spending because the demand is stable and the customer relationship is locked in with the retailer.
These foundational categories are the bedrock supporting the full-year 2025 Adjusted EBITDA guidance, which TreeHouse Foods maintained at $345 million to $375 million. That range represents the expected cash generation from these mature, high-share businesses, assuming continued operational discipline. Honestly, this is the part of the portfolio that funds everything else.
The financial output from these reliable lines is substantial. We are looking at mature product lines projected to generate significant free cash flow, specifically stated at a minimum of $130 million for the 2025 fiscal year. This cash is what you use to cover corporate overhead, service debt, and fund the riskier Question Marks.
To show you how these segments are performing right now, look at the Q3 2025 results. Pricing actions have successfully helped recover commodity inflation, which stabilized the gross profit margin at 18.8% for the quarter. That margin performance, even with some volume/mix headwinds, shows the pricing power and cost control in these core areas.
Here's a quick look at the key financial indicators from the third quarter of 2025 that illustrate the cash-generating nature of these units, even when factoring in broader company challenges:
| Metric | Q3 2025 Value | Context |
| Net Sales | $840.3 million | Stable top-line performance. |
| Gross Profit Margin | 18.8% | Margin stabilization following inflation recovery. |
| Adjusted EBITDA | $91.6 million | Quarterly cash flow generation. |
| Insurance Recoveries (Q3) | $17.5 million | One-time boost to profitability in the quarter. |
The strategy here isn't aggressive growth spending; it's about maintaining the current productivity level and milking the gains passively. Investments are targeted at infrastructure to improve efficiency and further boost that cash flow. For instance, supply chain savings initiatives were a major driver of EBITDA performance in Q2 2025, showing where capital deployment helps these cows produce more milk.
You can see the cash consumption profile, too. For the first nine months of 2025, net cash used in operating activities was $(62.5 million), which, while an increase in cash used year-over-year, still reflects the underlying cash generation capability of the business, especially when compared to the projected annual free cash flow.
These Cash Cows are the business units you want to support with focused, efficiency-driving capital expenditures. They provide the financial stability you need:
- Core, established private label pantry staples with high relative market share and stable demand.
- Foundational categories that contribute to the full-year 2025 Adjusted EBITDA guidance of $345 million to $375 million.
- Mature product lines that generate significant free cash flow, projected at at least $130 million for 2025.
- Segments where pricing actions have successfully recovered commodity inflation, stabilizing gross profit margin at 18.8% in Q3 2025.
Finance: draft 13-week cash view by Friday.
TreeHouse Foods, Inc. (THS) - BCG Matrix: Dogs
You're looking at the units within TreeHouse Foods, Inc. (THS) that are clearly stuck in the Dogs quadrant-low market growth and low relative market share. These are the businesses that tie up capital without offering much return, making divestiture the logical next step, especially given the company's recent strategic pivots.
One of the most concrete examples of shedding a Dog was the exit of the Ready-to-drink (RTD) business. This move was part of a broader portfolio optimization that concluded in the first quarter of 2025. Looking at the nine-month figures leading up to Q3 2025, the RTD business exit contributed a negative 0.7% impact to the change in adjusted net sales, showing it was a drag on the top line before being removed.
The most severe financial manifestation of carrying underperforming assets came in the third quarter of 2025. TreeHouse Foods recognized a massive non-cash goodwill impairment loss of $289.7 million in Q3 2025. This charge, which pushed the net loss for the quarter to $265.8 million, signals that the carrying value of certain legacy units was no longer supported by their expected future performance. Honestly, an impairment of this magnitude suggests that expensive turn-around plans for those specific assets were not viable.
Another area that fits the Dog profile, due to operational failures and market share erosion, involved the frozen griddle products. Following a voluntary recall initiated in late 2024 due to potential Listeria monocytogenes contamination, the business faced service impacts. For the first quarter of 2025, these griddle recall service impacts accounted for a 2.4% negative contribution to adjusted net sales. By the third quarter, the cumulative impact on nine-month adjusted net sales from these service issues was (1.2)%. To be fair, the company did receive $17.5 million in insurance recoveries related to these voluntary product recalls in Q3 2025, which helped the gross profit margin for that quarter, but the underlying product line performance remained weak.
Finally, several product lines are suffering from sustained distribution losses coupled with negative volume/mix trends, which is the classic symptom of a Dog. For the three months ended in Q3 2025, the total Volume/mix factor resulted in an (8.6)% decline in net sales. Over the nine months of 2025, the total volume/mix decline was (4.6)%. These negative trends, alongside planned margin management actions, are what management cited as key offsets to pricing gains and acquisition contributions.
Here's a quick look at how these specific negative drivers impacted the top line in the first three quarters of 2025:
| Negative Driver | Period | Impact on Adjusted Net Sales |
|---|---|---|
| Total Volume/mix | Three Months Ended Q3 2025 | (8.6)% |
| Total Volume/mix | Nine Months Ended Q3 2025 | (4.6)% |
| Griddle recall service impacts | Three Months Ended Q1 2025 | (2.4)% |
| Griddle recall service impacts | Nine Months Ended Q3 2025 | (1.2)% |
| RTD business exit | Nine Months Ended Q3 2025 | (0.7)% |
The impairment loss of $289.7 million in Q3 2025 is the clearest signal that management has accepted the low-growth, low-share reality for a portion of its portfolio. These units are prime candidates for divestiture to free up cash for Stars or Cash Cows. Finance: draft the projected cash flow impact of a hypothetical divestiture of the legacy assets associated with the goodwill impairment by next Wednesday.
TreeHouse Foods, Inc. (THS) - BCG Matrix: Question Marks
You're looking at business units or brands within TreeHouse Foods, Inc. (THS) that are operating in markets with strong potential, but where the company currently holds a low position. These are the cash consumers, the ones that require capital to fight for share.
These Question Marks are tied to segments contributing to the overall 2025 volume/mix decline of approximately 1% year-over-year, based on the full-year adjusted net sales guidance. This decline signals an immediate need for investment to reverse share loss in these growing areas. The overall adjusted net sales guidance for 2025 reflects this pressure, projecting a range from a decline of approximately 0.5% to growth of approximately 1%.
The company is allocating significant resources to try and shift these units into the Star quadrant. This is evident in the deployment of the 2025 capital expenditures budget, which is approximately $125 million, earmarked for business investment and growth initiatives. This heavy capital use is necessary to gain traction against established competitors in these high-potential spaces.
The market context shows that private brands, the core of TreeHouse Foods, Inc. (THS), have grown their market share to approximately 25% year-to-date in 2025, up from 16% in 2006. However, specific categories are struggling, as seen in the third quarter 2025 results where the total volume/mix decline was (11.6)% for the quarter. You need to see quick market share gains, or these units become Dogs.
Here is a look at the financial context surrounding these investment areas:
| Metric | Value/Amount | Period/Context |
| 2025 Capital Expenditures | $125 million | Full Year 2025 Investment for Growth |
| Full Year 2025 Volume/Mix Impact (Guidance) | Approx. (1)% decline | Year-over-Year Adjusted Net Sales Driver |
| Q3 2025 Total Volume/Mix Change | (11.6)% | Third Quarter Performance |
| Private Brand Market Share | 25% | Year-to-Date 2025 |
These Question Marks represent new product innovation areas, such as those requiring heavy capital for scaling, which are currently consuming cash to build the necessary market presence. The strategy here is clear:
- Invest heavily to capture market share quickly.
- Focus capital expenditures of approximately $125 million on these growth vectors.
- Reverse the negative volume/mix trends, which contributed to an approximate 1% overall decline in 2025 guidance.
You are betting that the high growth prospects in these categories will eventually justify the current cash burn. If they don't gain traction, the capital is better divested.
Disclaimer
All information, articles, and product details provided on this website are for general informational and educational purposes only. We do not claim any ownership over, nor do we intend to infringe upon, any trademarks, copyrights, logos, brand names, or other intellectual property mentioned or depicted on this site. Such intellectual property remains the property of its respective owners, and any references here are made solely for identification or informational purposes, without implying any affiliation, endorsement, or partnership.
We make no representations or warranties, express or implied, regarding the accuracy, completeness, or suitability of any content or products presented. Nothing on this website should be construed as legal, tax, investment, financial, medical, or other professional advice. In addition, no part of this site—including articles or product references—constitutes a solicitation, recommendation, endorsement, advertisement, or offer to buy or sell any securities, franchises, or other financial instruments, particularly in jurisdictions where such activity would be unlawful.
All content is of a general nature and may not address the specific circumstances of any individual or entity. It is not a substitute for professional advice or services. Any actions you take based on the information provided here are strictly at your own risk. You accept full responsibility for any decisions or outcomes arising from your use of this website and agree to release us from any liability in connection with your use of, or reliance upon, the content or products found herein.