|
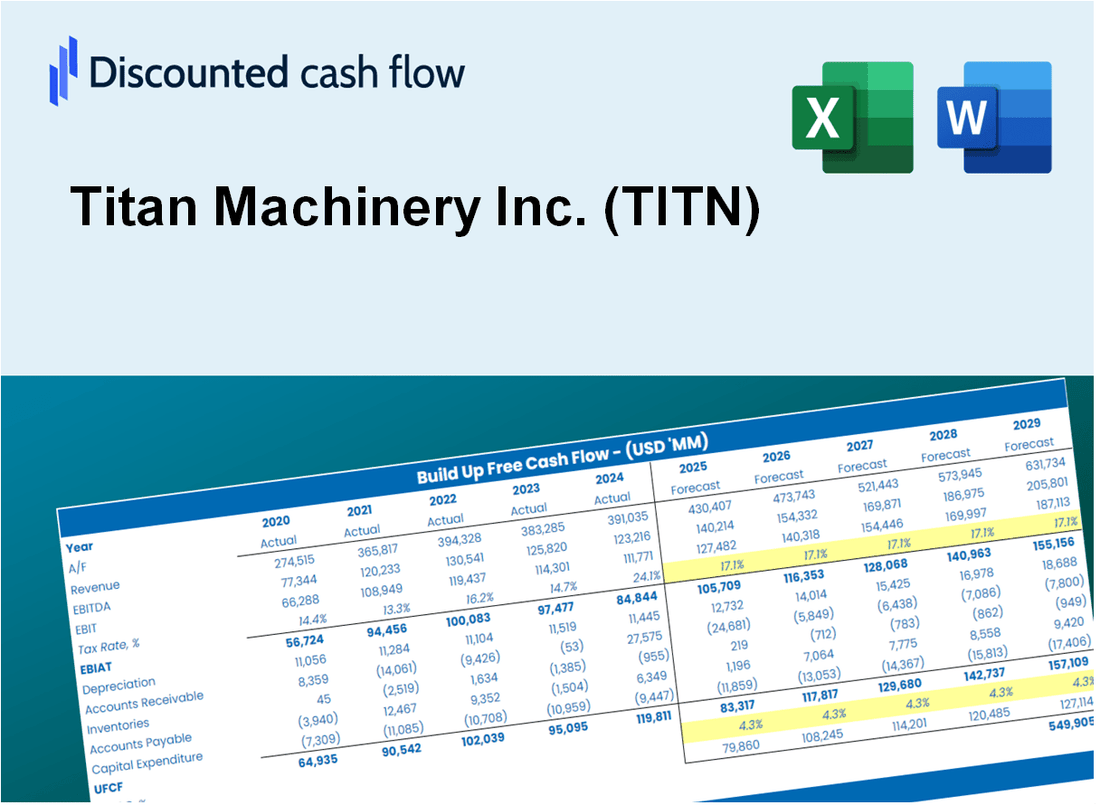
Titan Machinery Inc. (TITN) DCF Valuation |
Fully Editable: Tailor To Your Needs In Excel Or Sheets
Professional Design: Trusted, Industry-Standard Templates
Investor-Approved Valuation Models
MAC/PC Compatible, Fully Unlocked
No Expertise Is Needed; Easy To Follow
Titan Machinery Inc. (TITN) Bundle
Enhance your investment strategies with the Titan Machinery Inc. (TITN) DCF Calculator! Dive into real financial data for Titan Machinery, adjust growth assumptions and expenses, and instantly observe how modifications affect the intrinsic value of Titan Machinery Inc. (TITN).
What You Will Get
- Real Titan Machinery Data: Preloaded financials – from revenue to EBIT – based on actual and projected figures.
- Full Customization: Adjust all critical parameters (yellow cells) like WACC, growth %, and tax rates.
- Instant Valuation Updates: Automatic recalculations to analyze the impact of changes on Titan Machinery’s fair value.
- Versatile Excel Template: Tailored for quick edits, scenario testing, and detailed projections.
- Time-Saving and Accurate: Skip building models from scratch while maintaining precision and flexibility.
Key Features
- 🔍 Real-Life TITN Financials: Pre-filled historical and projected data for Titan Machinery Inc.
- ✏️ Fully Customizable Inputs: Adjust all critical parameters (yellow cells) like WACC, growth %, and tax rates.
- 📊 Professional DCF Valuation: Built-in formulas calculate Titan Machinery’s intrinsic value using the Discounted Cash Flow method.
- ⚡ Instant Results: Visualize Titan Machinery’s valuation instantly after making changes.
- Scenario Analysis: Test and compare outcomes for various financial assumptions side-by-side.
How It Works
- Step 1: Download the Excel file for Titan Machinery Inc. (TITN).
- Step 2: Review Titan Machinery’s pre-filled financial data and projections.
- Step 3: Adjust key inputs such as revenue growth, WACC, and tax rates (highlighted cells).
- Step 4: Observe the DCF model refresh in real-time as you modify your assumptions.
- Step 5: Evaluate the outputs and leverage the findings for your investment strategies.
Why Choose This Calculator for Titan Machinery Inc. (TITN)?
- All-in-One Solution: Offers DCF, WACC, and financial ratio analyses tailored for Titan Machinery Inc. (TITN).
- Flexible Inputs: Modify the yellow-highlighted cells to explore different financial scenarios.
- In-Depth Analysis: Automatically computes the intrinsic value and Net Present Value specific to Titan Machinery Inc. (TITN).
- Loaded with Data: Comes with historical and projected data for accurate evaluations.
- High-Quality Standards: Perfect for financial analysts, investors, and business advisors focusing on Titan Machinery Inc. (TITN).
Who Should Use This Product?
- Individual Investors: Make informed decisions about buying or selling Titan Machinery Inc. (TITN) stock.
- Financial Analysts: Streamline valuation processes with ready-to-use financial models specific to Titan Machinery Inc. (TITN).
- Consultants: Deliver professional valuation insights on Titan Machinery Inc. (TITN) to clients quickly and accurately.
- Business Owners: Understand how companies like Titan Machinery Inc. (TITN) are valued to guide your own strategy.
- Finance Students: Learn valuation techniques using real-world data and scenarios related to Titan Machinery Inc. (TITN).
What the Template Contains
- Comprehensive DCF Model: Editable template featuring detailed valuation calculations tailored for Titan Machinery Inc. (TITN).
- Real-World Data: Historical and projected financials for Titan Machinery preloaded for in-depth analysis.
- Customizable Parameters: Modify WACC, growth rates, and tax assumptions to explore various scenarios.
- Financial Statements: Complete annual and quarterly breakdowns for enhanced insights into Titan Machinery's performance.
- Key Ratios: Integrated analysis focusing on profitability, efficiency, and leverage metrics specific to Titan Machinery.
- Dashboard with Visual Outputs: Engaging charts and tables that present clear, actionable results for Titan Machinery Inc. (TITN).
Disclaimer
All information, articles, and product details provided on this website are for general informational and educational purposes only. We do not claim any ownership over, nor do we intend to infringe upon, any trademarks, copyrights, logos, brand names, or other intellectual property mentioned or depicted on this site. Such intellectual property remains the property of its respective owners, and any references here are made solely for identification or informational purposes, without implying any affiliation, endorsement, or partnership.
We make no representations or warranties, express or implied, regarding the accuracy, completeness, or suitability of any content or products presented. Nothing on this website should be construed as legal, tax, investment, financial, medical, or other professional advice. In addition, no part of this site—including articles or product references—constitutes a solicitation, recommendation, endorsement, advertisement, or offer to buy or sell any securities, franchises, or other financial instruments, particularly in jurisdictions where such activity would be unlawful.
All content is of a general nature and may not address the specific circumstances of any individual or entity. It is not a substitute for professional advice or services. Any actions you take based on the information provided here are strictly at your own risk. You accept full responsibility for any decisions or outcomes arising from your use of this website and agree to release us from any liability in connection with your use of, or reliance upon, the content or products found herein.