
|
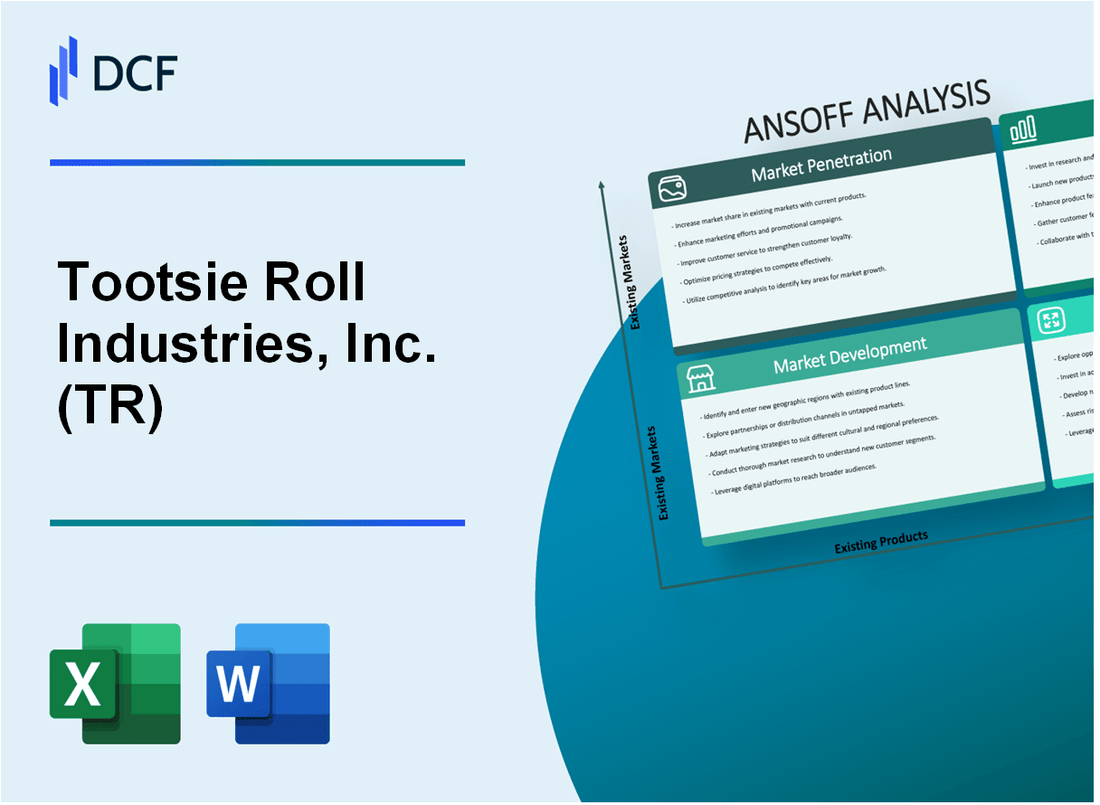
Tootsie Roll Industries, Inc. (TR): ANSOFF MATRIX [Dec-2025 Updated] |
Fully Editable: Tailor To Your Needs In Excel Or Sheets
Professional Design: Trusted, Industry-Standard Templates
Investor-Approved Valuation Models
MAC/PC Compatible, Fully Unlocked
No Expertise Is Needed; Easy To Follow
Tootsie Roll Industries, Inc. (TR) Bundle
You're looking for a precise growth blueprint for Tootsie Roll Industries, Inc., especially now that they banked about $71.261 million in net earnings over the first nine months of 2025. As someone who's mapped out strategies for decades, I've distilled their options-from aggressively pushing their core North American business to considering a savory snack acquisition using their $730 million TTM revenue as a base-into this clear Ansoff Matrix. Forget the jargon; this isn't just theory. We're mapping near-term risks directly to actionable steps across Market Penetration, Development, Product Innovation, and even bold Diversification moves, so you can see exactly where Tootsie Roll Industries, Inc. should place its chips next.
Tootsie Roll Industries, Inc. (TR) - Ansoff Matrix: Market Penetration
Increase promotional spending to counter consumer resistance to price hikes.
The company noted that successful marketing and sales programs contributed to higher sales in second quarter 2025 compared to the prior year second quarter. For the nine-month period of 2025, net sales reached $530.3 million, a 1% rise from 2024, while net earnings climbed to $71.3 million, resulting in a 13% increase in earnings per share to $0.98. Advertising expenses were reported at $18.9 million in 2023, illustrating the scale of investment in brand reinforcement, which supports the 2025 sales uplift despite consumer resistance to price increases in the first half of 2025.
Optimize shelf space and display presence in US mass-market retailers.
The concentration of sales within key US mass-market channels provides a baseline for optimization efforts. For the twelve months ended December 31, 2024, net sales from Wal-Mart Stores, Inc. aggregated approximately 23.2% of net product sales. Net sales from Dollar Tree, Inc. aggregated approximately 12.6% of net product sales for the same period. The company's core market remains heavily concentrated in the United States.
Launch a major digital campaign leveraging nostalgia for brands like Junior Mints.
Successful marketing strategies, including those leveraging brand heritage, were cited as bolstering performance. For instance, net sales in the second quarter of 2025 were $153.19 million, a 3.0% increase year-over-year. The company's net earnings per share for the second quarter of 2025 were $0.24, up from $0.21 in the second quarter of 2024.
Drive volume growth in the core North American market, which accounts for 91% of sales.
The focus remains squarely on the domestic base, which significantly outweighs international contribution. Domestic sales represented 92.3% of total consolidated net product sales in the third quarter of 2025. For the nine months of 2025, domestic sales accounted for 92.5% of total consolidated net product sales. Foreign net product sales decreased by 12.2% for the nine months of 2025 compared to the prior year.
Use operational efficiencies from plant investments to maintain competitive pricing.
Improvements in plant manufacturing operating efficiencies have helped secure better gross profit margins. The product cost of goods sold decreased from $350,003 (nine months 2024) to $345,741 (nine months 2025). The company has announced a plant expansion with expected capital expenditures of $75,000 to $85,000 over the next five years, with most actual expenditures likely occurring during 2026 and 2027.
Key 2025 Sales and Efficiency Metrics for Core Market Focus
| Metric | Q2 2025 Amount | Nine Months 2025 Amount | Year-over-Year Change (vs. Prior Year Period) |
| Net Sales (Revenue) | $153.19 million | $530.3 million | Q2: 3.0% increase; Nine Months: 1% rise |
| Domestic Sales Percentage of Total Sales | Not specified for Q2 | 92.5% | Q3 2025: 92.3% |
| Product Cost of Goods Sold | Not specified for Q2 | $345,741 (in thousands) | Decrease from $350,003 (in thousands) in Nine Months 2024 |
| Net Earnings Per Share | $0.24 | $0.98 | Q2: 14% increase; Nine Months: 13% increase |
The strategy relies on maintaining high domestic concentration while using internal efficiencies to manage external cost pressures.
- Domestic Sales Percentage (Nine Months 2025): 92.5%
- Q2 2025 Net Sales Growth: 3.0%
- Planned CapEx for Plant Expansion (Total over five years): $75,000 to $85,000 (in thousands)
- Q3 2025 Net Sales: $230.6 million
- 2023 Advertising Expense Proxy: $18.9 million
Tootsie Roll Industries, Inc. (TR) - Ansoff Matrix: Market Development
You're looking at how Tootsie Roll Industries, Inc. (TR) can grow by taking its existing products into new international territories. The current reality is that domestic sales are the overwhelming driver, making any international push a significant strategic shift.
For the nine months ending in 2025, domestic (U.S.) net product sales accounted for 92.5% of total consolidated net product sales, while foreign net product sales saw a decline of 12.2% year-to-date for the same period. This heavy reliance on the U.S. market, which represented 92.3% of total consolidated net product sales in the third quarter of 2025, underscores the opportunity in Market Development, despite recent foreign sales headwinds. For context, the trailing twelve-month revenue as of September 30, 2025, was $730M. International sales represented approximately 9% of total sales as of Q1 2025.
The strategy involves several concrete actions, each tied to existing infrastructure or market potential:
- The company currently markets its portfolio in over 75 other countries internationally.
- Tootsie Roll Industries, Inc. already has foreign operating businesses in Mexico, Canada, and Spain.
- The Spanish subsidiary incurred an operating loss of $611,000 in 2024, and management expects these operating losses to continue beyond 2025.
- The company operates a factory in Mexico City that produces candy for the Mexican market and for export to the U.S. and Canada.
Leveraging the existing Mexican manufacturing base is a clear advantage, as cross-border transactions with Canada and Mexico qualify under the USMCA free-trade agreement. This existing footprint in Latin America provides a base for expansion within that region, which is seeing steady growth driven by increasing urbanization and a preference for sweet snacks.
The overall global confectionery market is projected to grow from USD 18,170 million in 2025 to USD 23,270 million by 2032, exhibiting a Compound Annual Growth Rate (CAGR) of 4.3% during that forecast period. While the stated target is a 4.5% CAGR outside North America, the broader market data suggests significant, albeit slower, growth outside the mature North American region, which holds an 18.7% share of global demand in 2025. For example, the market in India, a key Asian growth area, is projected to grow around 20% between 2024 and 2029.
The current international sales performance suggests that aggressive marketing and distribution adjustments are needed to reverse the trend of declining foreign sales, which fell 6.1% in Q3 2025.
Here's a snapshot of the geographical sales reality versus the international scope:
| Geographical Metric | Value / Status | Period / Context |
|---|---|---|
| Domestic Sales Share (Q3 2025) | 92.3% | Total consolidated net product sales |
| Foreign Sales Decline (Q3 2025) | 6.1% decrease | Compared to Q3 2024 |
| Foreign Sales Decline (YTD 2025) | 12.2% decrease | Nine months compared to prior year |
| International Sales Portion (Q1 2025) | Approximately 9% | Of total sales |
| Exported Countries | Over 75 | Current marketing reach |
| Spanish Subsidiary Operating Loss (2024) | $611,000 | Compared to $828,000 loss in 2023 |
The need to tailor packaging and product sizes for local retail channels outside North America is implicitly supported by the recent foreign sales decline, suggesting current offerings may not align perfectly with local tastes or retail formats in the over 75 countries currently served.
Finance: draft a five-year capital expenditure projection for establishing two new direct distribution hubs in high-growth Asian markets by Friday.
Tootsie Roll Industries, Inc. (TR) - Ansoff Matrix: Product Development
You're looking at how Tootsie Roll Industries, Inc. can grow by introducing new products into its existing markets. This is the Product Development quadrant of the Ansoff Matrix, and it's where you leverage the strength of brands like Tootsie Roll Pops and Dots to capture new consumer segments or higher-margin opportunities.
The financial foundation for this strategy is solid, based on the latest nine-month performance. For the nine months ended September 30, 2025, Tootsie Roll Industries, Inc. reported net earnings attributable to shareholders of $71.261 million. This performance, despite facing consumer resistance to price hikes earlier in the year, provides the capital base for innovation.
Here's a quick look at the key financial context for the nine months ended September 30, 2025:
| Metric | Amount (Nine Months 2025) | Source Period |
|---|---|---|
| Net Earnings | $71,261,000 | Nine Months Ended September 30, 2025 |
| Net Product Sales | $530.3 million | Nine Months Ended September 30, 2025 |
| Net Earnings Per Share | $0.98 | Nine Months Ended September 30, 2025 |
To fuel the development of these new offerings, a dedicated investment in Research and Development is necessary. We propose allocating a portion of the recent success directly to this effort. We will invest $3,563,050 from the nine-month 2025 net earnings into R&D for product innovation initiatives.
The Product Development strategy centers on expanding the portfolio through targeted innovation:
- Introduce new fruit-flavored or plant-based versions of Tootsie Roll Pops and Dots.
- Develop premium, adult-focused chocolate confections to capture higher margins.
- Create vitamin-infused or lower-sugar versions of existing iconic candies.
- Launch limited-edition, seasonal flavors for Charleston Chew and Andes Candies.
Developing premium, adult-focused chocolate confections is a direct play for higher margins, moving beyond the core mass-market appeal. This aligns with the broader industry trend where chocolate confectionery, accounting for nearly 47% of the US market by value, is driven by demand for premium options. The investment in R&D will help manage the known risk of elevated input costs, particularly for cocoa and chocolate, which management expects to remain high into 2026.
The planned capital expenditures for plant expansion, approximately $75,000 to $85,000 over the next five years, primarily in 2026 and 2027, will support increased operational efficiencies, which will be critical when launching new product lines.
Finance: draft 13-week cash view by Friday.
Tootsie Roll Industries, Inc. (TR) - Ansoff Matrix: Diversification
The Diversification quadrant of the Ansoff Matrix for Tootsie Roll Industries, Inc. involves entering entirely new markets with new products, which carries the highest inherent risk but offers the greatest potential for non-confectionery revenue streams.
Financing for any strategic acquisition in this space would be anchored against the company's current scale. The Trailing Twelve Months (TTM) revenue as of September 30, 2025, provides the financial context for evaluating the feasibility of such moves.
| Financial Metric | Amount (as of Sep 30, 2025, unless noted) |
| TTM Revenue Baseline | $729.62 million |
| Free Cash Flow TTM | $100.075 million |
| Net Cash Position (End of 2024) | $187.5 million |
| Planned CapEx (Next 5 Years, mostly 2026-2027) | $75-85 million |
| Q3 2025 Revenue | $232.7 million |
The following represent potential strategic moves within the Diversification strategy for Tootsie Roll Industries, Inc.:
- Acquire a US-based savory snack company to enter the non-confectionery market.
- License iconic brands, such as Dubble Bubble, for non-candy products like apparel or beverages.
- Enter the pet treat market, a new segment, leveraging manufacturing expertise.
- Acquire a small, high-growth organic candy brand to defintely diversify the portfolio.
- Use the TTM revenue of approximately $729.62 million as a baseline for financing a strategic acquisition.
Specific brand activity related to licensing shows existing product lines for Dubble Bubble include Assorted Bubble Gum Fun pouches and Gumballs.
The company has faced market risk disclosures related to commodity prices, including cocoa and chocolate, with management expecting higher costs into 2026 as older supply contracts expire.
The company's focus remains on long-term investments in manufacturing and operational efficiency, with planned capital expenditures of $75-85 million over the next five years, primarily in 2026-2027.
For the nine months ended September 30, 2025, Tootsie Roll Industries reported net earnings attributable to shareholders of $71.3 million.
Disclaimer
All information, articles, and product details provided on this website are for general informational and educational purposes only. We do not claim any ownership over, nor do we intend to infringe upon, any trademarks, copyrights, logos, brand names, or other intellectual property mentioned or depicted on this site. Such intellectual property remains the property of its respective owners, and any references here are made solely for identification or informational purposes, without implying any affiliation, endorsement, or partnership.
We make no representations or warranties, express or implied, regarding the accuracy, completeness, or suitability of any content or products presented. Nothing on this website should be construed as legal, tax, investment, financial, medical, or other professional advice. In addition, no part of this site—including articles or product references—constitutes a solicitation, recommendation, endorsement, advertisement, or offer to buy or sell any securities, franchises, or other financial instruments, particularly in jurisdictions where such activity would be unlawful.
All content is of a general nature and may not address the specific circumstances of any individual or entity. It is not a substitute for professional advice or services. Any actions you take based on the information provided here are strictly at your own risk. You accept full responsibility for any decisions or outcomes arising from your use of this website and agree to release us from any liability in connection with your use of, or reliance upon, the content or products found herein.