
|
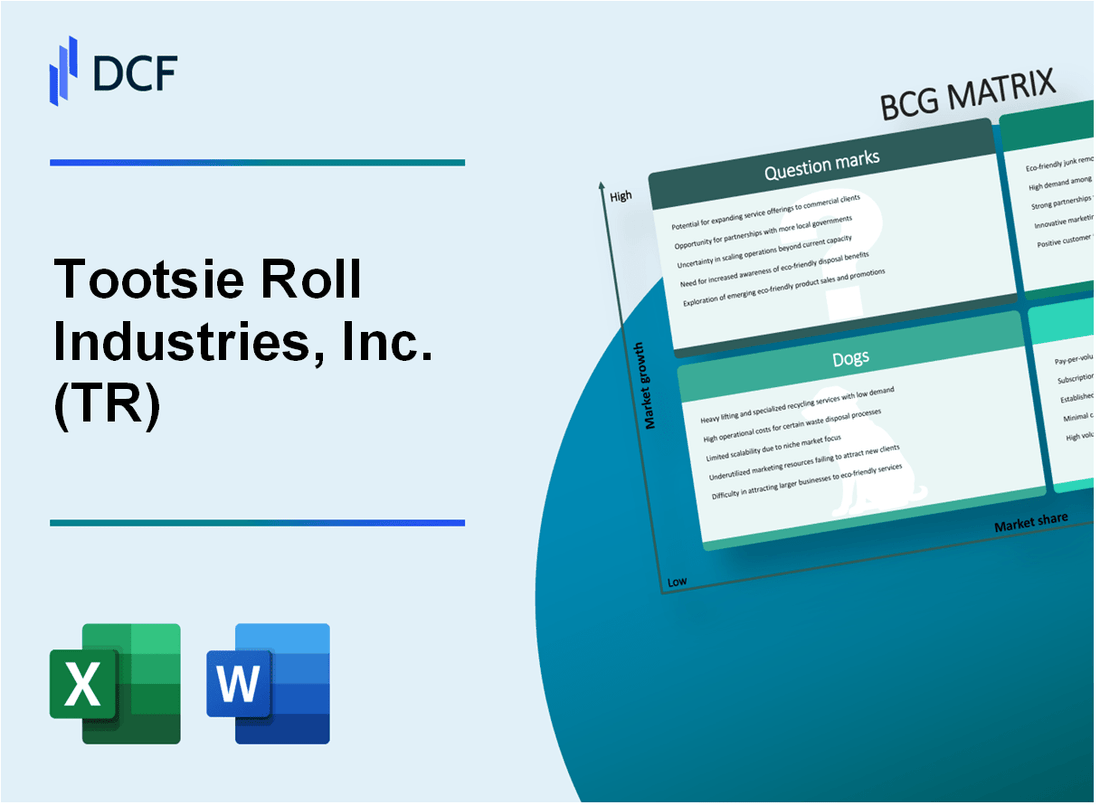
Tootsie Roll Industries, Inc. (TR): BCG Matrix [Dec-2025 Updated] |
Fully Editable: Tailor To Your Needs In Excel Or Sheets
Professional Design: Trusted, Industry-Standard Templates
Investor-Approved Valuation Models
MAC/PC Compatible, Fully Unlocked
No Expertise Is Needed; Easy To Follow
Tootsie Roll Industries, Inc. (TR) Bundle
You're looking for a clear-eyed view of Tootsie Roll Industries, Inc. (TR) through the BCG lens, mapping where their cash is generated and where their future bets lie. Honestly, the story is one of domestic strength versus international drag: core brands are driving a 3.8% Q3 2025 domestic sales lift, supporting that incredible 58-year dividend streak, while foreign sales have dropped 12.2% over the first nine months of the year. We'll break down exactly which legacy products are the Cash Cows sitting on a lean balance sheet with only $14.16 million in total debt, and where the big Question Mark bets-like international expansion that's currently only 9% of revenue and new capacity needing demand proof-need to prove their worth against the underperforming Dogs. Keep reading to see the strategic implications for TR's next move.
Background of Tootsie Roll Industries, Inc. (TR)
Tootsie Roll Industries, Inc. (TR) is a venerable American manufacturer in the confectionery sector, established way back in 1896 by Leo Hirschfield. You know them for their iconic, enduring candies, which form the bedrock of their business. The company's corporate office is located at 7401 South Cicero Avenue in Chicago, Illinois, and as of late 2025, they employ about 2,300 people.
The product portfolio is built around several well-known trademarks, with the namesake Tootsie Roll being the cornerstone. Still, the company also markets popular items like Tootsie Pops, Charms, Blow Pops, Dots, Junior Mints, Sugar Daddy, Sugar Babies, Andes, Dubble Bubble, and Razzles. Their strategy centers on protecting and strengthening these classic brands while maintaining consistent quality and accessibility for consumers of all ages.
Geographically, Tootsie Roll Industries, Inc. generates the bulk of its revenue domestically, with operations primarily focused on North America. For instance, in the third quarter of 2025, domestic net product sales accounted for 92.3% of their total consolidated net product sales. While they reach consumers in Canada, Mexico, and over 75 other countries, the U.S. market is definitely the main driver.
Looking at the financials through the first nine months of 2025 (ending September 30, 2025), the company reported net product sales of $530.325 million, with total revenue reaching $536.2 million. Net earnings for that nine-month period climbed to $71.261 million, resulting in an earnings per share (EPS) of $0.98. As of September 30, 2025, the trailing twelve-month revenue stood at $730M, and the market capitalization was approximately $1.75B.
The competitive landscape remains fierce, and as of the first quarter of 2025, Tootsie Roll Industries, Inc. held an overall market share of roughly 0.21%. Management has been actively implementing price increases to counter rising input costs, especially for cocoa and chocolate, which they anticipate will continue to pressure margins into 2026. To support future growth and efficiency, the company is planning significant capital expenditures of $75-85 million over the next five years, mostly scheduled for 2026 and 2027.
Tootsie Roll Industries, Inc. (TR) - BCG Matrix: Stars
Stars in the Boston Consulting Group Matrix represent business units or products with a high market share in a high-growth market. For Tootsie Roll Industries, Inc. (TR), these are the core brands that are currently leading sales momentum and are the focus of significant capital investment to secure future Cash Cow status.
The domestic segment, which represents the bulk of the business, is exhibiting the necessary growth characteristics. Domestic net product sales for the third quarter of 2025 increased by 3.0% year-over-year, reaching $230.6 million for that quarter alone. This growth is a key indicator of the high-growth market environment for their core products, despite some customer resistance to price increases noted over the nine-month period.
The primary drivers for this Star performance are the established core brands, which are successfully capitalizing on seasonal and promotional pushes. The company explicitly noted that successful marketing and sales programs, particularly pre-Halloween sales programs, were key contributors to the third quarter 2025 sales increase. This promotional success highlights the high market share these brands maintain when actively supported.
The investment thesis for these Stars is clear: significant capital expenditure is being deployed to support their market leadership and improve future cost structures. Tootsie Roll Industries is pursuing a plant expansion with planned capital expenditures (CapEx) between $75 million and $85 million over the next five years, with the bulk of this spending expected in 2026 and 2027. This investment is aimed at meeting higher forecasted demand and improving manufacturing efficiencies to offset input cost pressures. As an initial signal of this investment cycle, capital expenditures in the first quarter of 2025 alone totaled $2.852 million.
The product lines considered Stars benefit directly from this capacity expansion, as they are the volume drivers. These include the iconic heritage brands and specific seasonal performers that demonstrate high demand during peak periods. The company's key brands, which form the backbone of this segment, include Tootsie Rolls, Tootsie Pops, Charms Blow Pop, Andes Mints, and the seasonal favorites.
You can see the financial context supporting the Star category below:
| Metric | Value/Amount | Period/Context |
| Q3 2025 Net Product Sales Growth | 3.0% | Year-over-year |
| Q3 2025 Net Sales | $230.6 million | Reported |
| Nine Months 2025 Net Sales Growth | 1.2% | Year-over-year |
| Planned Plant Expansion CapEx | $75 million to $85 million | Over five years (mostly 2026-2027) |
| Q1 2025 Capital Expenditures | $2.852 million | Signaling immediate investment start |
| Nine Months 2025 Net Earnings | $71.3 million | Up 10.8% year-over-year |
Specific, high-demand seasonal items are crucial for maximizing the high-growth period for these Stars. While exact 2025 seasonal sales figures aren't public, the product focus is evident in packaging and promotions:
- The Junior Mints brand features specific holiday packaging, such as the Junior Mints Christmas (8.5 oz. Bag), offered in multi-pack configurations like a 3-Pack for $20.97.
- The Dots brand is included in major seasonal assortments, such as the 55-count Halloween bag, which also features Junior Mints.
- The company is actively promoting seasonal lollipop variants, such as Tootsie Peppermint Pops, for the holiday season.
These products, supported by successful holiday programs, are the current market share leaders that Tootsie Roll Industries is pouring capital into. If they maintain this success as the market growth eventually moderates, they are positioned to transition into the Cash Cow quadrant, providing stable returns to fund future growth initiatives.
Tootsie Roll Industries, Inc. (TR) - BCG Matrix: Cash Cows
Cash Cows for Tootsie Roll Industries, Inc. (TR) are those established brands operating in mature segments, commanding significant market presence while requiring minimal growth investment, thereby maximizing free cash flow generation to support the broader corporate structure.
Flagship brands: Tootsie Roll and Tootsie Pop, which maintain high market share via brand legacy. The company's operations are principally in North America, with cross-border transactions qualifying under the USMCA free-trade agreement.
This stability directly underpins the company's commitment to shareholders. Tootsie Roll Industries boasts a 59-year dividend growth streak, earning it the merit of a Dividend King and Champion. The dividend growth rate in the trailing five years was 3%. The annualized DPS was reported at $1.29 per share, representing a current dividend yield of 3.36% as of October 7, 2025.
Consistent, stable revenue stream supporting the 58-year dividend growth streak. The nine months ended September 30, 2025, saw revenue of $536.25 million, an increase from $529.85 million a year ago. Net income for the nine-month period was $71.26 million, up from $64.32 million in the prior year period.
Strong brand equity allows for strategic price increases to offset rising input costs. Management has implemented price increases to mitigate input costs, particularly for cocoa and chocolate, which saw unit costs increase in the nine months of 2025 compared to 2024. The company's current net profit margins stand at 12.9%. The company continually invests in its manufacturing operations to increase operational efficiencies. Capital expenditures were $18.4 million in 2024.
The third quarter 2025 results illustrate this cash generation:
| Metric | Q3 2025 Value | Q3 2024 Value |
| Revenue (USD) | $232.71 million | $225.93 million |
| Net Income (USD) | $35.66 million | $32.84 million |
| Basic EPS from Continuing Operations (USD) | $0.49 | $0.45 |
The company's conservative balance sheet, with only $14.16 million in total debt as of Q3 2025. Total debt on the balance sheet as of September 2025 was reported as $14.16 Million USD. This low debt level supports the company's ability to fund operations and shareholder returns without significant interest expense burden. The company ended 2024 with $429 million of cash and investments, net of interest-bearing debt.
The focus on maintaining productivity in these established lines involves specific actions:
- Continue making investments in plant manufacturing operations.
- Achieve product quality improvements and expand capacity in certain product lines.
- Strive to keep operations lean to maximize efficiency.
- Earnings per share benefited from stock purchases in the open market over the preceding twelve months.
Tootsie Roll Industries, Inc. (TR) - BCG Matrix: Dogs
Dogs, in the Boston Consulting Group Matrix framework, represent business units or product lines operating in low-growth markets with a low relative market share. These units typically neither generate nor consume significant cash, often breaking even, but they tie up capital that could be better deployed elsewhere. For Tootsie Roll Industries, Inc. (TR), this quadrant likely houses legacy brands or international operations where market penetration is minimal and growth is stagnant or negative.
The international segment clearly exhibits characteristics aligning with a Dog position, as evidenced by the recent performance data. Foreign net product sales experienced a significant contraction over the first nine months of 2025. This decline suggests these markets are either mature, highly competitive, or less receptive to the current product mix, fitting the low-growth/low-share profile.
| Metric | Period Ended September 30, 2025 | Change vs. Prior Year Period |
| Foreign Net Product Sales Change | Not specified for the period | -12.2% (Nine Months) |
| Domestic (U.S.) Net Product Sales Change | Not specified for the period | +2.4% (Nine Months) |
| Domestic Share of Total Net Product Sales | 92.5% (Nine Months) | N/A |
The resistance to price adjustments is a key indicator of low pricing power, a common trait for Dogs in a competitive environment. When consumers push back on price hikes, it signals that the product is not perceived as sufficiently differentiated or essential, forcing the company to absorb margin pressure or accept lower volumes. This dynamic is particularly evident when looking at the overall company's top-line performance, which suggests that the growth from stronger segments is being offset by weakness elsewhere.
The overall Trailing Twelve Months (TTM) revenue growth as of September 2025 reflects this drag. While some segments may be performing adequately, the overall company growth rate suggests that the Dog category is not contributing meaningfully to expansion, acting more as a capital sink or, at best, a break-even operation.
- TTM Revenue Growth (as of September 2025): 0.8%
- Overall Market Share (Q1 2025): Approximately 0.24% against key competitors
- Consumer Headwind: Customers and consumers became more resistant to higher prices in the nine months of 2025, adversely affecting sales
- Low Growth Category Indicator: Foreign net product sales decreased by 12.2% for the nine months of 2025
Brands falling into this category are often older, niche offerings that lack the scale to compete effectively against market leaders in high-growth segments. They require minimal, if any, new investment for expansion, as expensive turn-around plans rarely yield sufficient returns to justify the outlay. The strategy here is typically to minimize cash consumption, perhaps by reducing marketing spend to near zero, and harvest any remaining cash flow until divestiture becomes feasible.
Tootsie Roll Industries, Inc. (TR) - BCG Matrix: Question Marks
These business units are characterized by operating in high-growth market segments but currently hold a low relative market share for Tootsie Roll Industries, Inc. They require significant cash infusion to capture market share before they risk becoming Dogs.
Potential Question Marks for Tootsie Roll Industries, Inc. center on areas requiring substantial investment to capture future growth, such as product diversification and international market penetration, while simultaneously managing significant input cost volatility.
Potential new product innovations aimed at healthier or reduced-sugar confectionery options represent a high-growth area in the confectionery space, but Tootsie Roll Industries, Inc. has not extensively detailed specific new product launches for 2024-2025. The company is, however, investing in manufacturing to meet new product demands, suggesting these initiatives are in the pipeline. The challenge here is gaining rapid adoption in a segment where competitors are consistently introducing novelties with healthier ingredient profiles.
Efforts to expand market penetration beyond the core North American region fit the Question Mark profile perfectly. International sales currently represent about $\text{9\%}$ of total revenue. This low share exists despite the global confectionery market outside North America being anticipated to grow at a $\text{4.5\%}$ Compound Annual Growth Rate (CAGR) through 2028. The reality of this low share is underscored by recent performance: foreign net product sales decreased by $\text{6.1\%}$ in the third quarter of 2025 and by $\text{-12.2\%}$ for the nine months of 2025. Conversely, domestic sales represented $\text{92.3\%}$ of total consolidated net product sales in the third quarter of 2025.
The new manufacturing capacity from the upcoming plant expansion is a major cash commitment that must translate into increased market share for its associated products to avoid becoming a Dog. Tootsie Roll Industries, Inc. announced a plant expansion backed by a planned capital expenditure of $\text{US\$75,000}$ to $\text{US\$85,000}$ over five years, with the bulk of this spending expected in 2026 and 2027. This investment signals confidence in future demand but requires successful execution to prove the demand is there for the increased output. For context, capital expenditures in 2024 totaled $\text{US\$18.4}$ million.
Product lines highly exposed to elevated cocoa and chocolate costs are consuming cash due to high input expenses without the market share to easily absorb them. Management explicitly stated that even higher cocoa and chocolate costs were expected in 2025 as older supply contracts expired and new, higher-cost contracts took effect. While forecasts suggest some relief, cocoa futures are expected to remain structurally elevated at around $\text{\$6,000/t}$ into 2026. Some analysts project New York cocoa futures could fall by $\text{-21\%}$ in 2026.
Here is a snapshot of relevant financial data for Tootsie Roll Industries, Inc. as of the latest reported periods:
| Metric | Value (Q3 2025 or Nine Months 2025) | Comparison/Context |
|---|---|---|
| Total Consolidated Net Product Sales (Q3 2025) | $\text{US\$232.71}$ million | $\text{3.0\%}$ increase year-over-year |
| Domestic Net Product Sales (Nine Months 2025) | $\text{92.5\%}$ of total | Foreign net product sales decreased $\text{-12.2\%}$ for the same period |
| International Revenue Share | $\text{9\%}$ | Global non-North American market CAGR projected at $\text{4.5\%}$ through 2028 |
| Planned CapEx for Plant Expansion (Over 5 Years) | $\text{US\$75,000}$ to $\text{US\$85,000}$ | Primarily occurring in 2026 and 2027 |
| Expected Cocoa Price (Into 2026) | Structurally elevated around $\text{\$6,000/t}$ | Forecasted fall of $\text{-21\%}$ for New York futures in 2026 |
The strategy for these Question Marks involves heavy investment to quickly shift them into the Star quadrant, or divestiture if the growth prospects do not materialize. You need to monitor the success of the plant expansion in driving volume to offset the high input costs.
- Invest heavily to gain market share quickly.
- Increase market share or risk becoming a Dog.
- Consume cash due to low current market share.
- Align innovation with $\text{4.5\%}$ CAGR international growth.
Finance: finalize the 2026 capital allocation plan prioritizing the plant expansion by end of Q1 2026.
Disclaimer
All information, articles, and product details provided on this website are for general informational and educational purposes only. We do not claim any ownership over, nor do we intend to infringe upon, any trademarks, copyrights, logos, brand names, or other intellectual property mentioned or depicted on this site. Such intellectual property remains the property of its respective owners, and any references here are made solely for identification or informational purposes, without implying any affiliation, endorsement, or partnership.
We make no representations or warranties, express or implied, regarding the accuracy, completeness, or suitability of any content or products presented. Nothing on this website should be construed as legal, tax, investment, financial, medical, or other professional advice. In addition, no part of this site—including articles or product references—constitutes a solicitation, recommendation, endorsement, advertisement, or offer to buy or sell any securities, franchises, or other financial instruments, particularly in jurisdictions where such activity would be unlawful.
All content is of a general nature and may not address the specific circumstances of any individual or entity. It is not a substitute for professional advice or services. Any actions you take based on the information provided here are strictly at your own risk. You accept full responsibility for any decisions or outcomes arising from your use of this website and agree to release us from any liability in connection with your use of, or reliance upon, the content or products found herein.