
|
Trident Limited (TRIDENT.NS): Ansoff Matrix |
Fully Editable: Tailor To Your Needs In Excel Or Sheets
Professional Design: Trusted, Industry-Standard Templates
Investor-Approved Valuation Models
MAC/PC Compatible, Fully Unlocked
No Expertise Is Needed; Easy To Follow
Trident Limited (TRIDENT.NS) Bundle
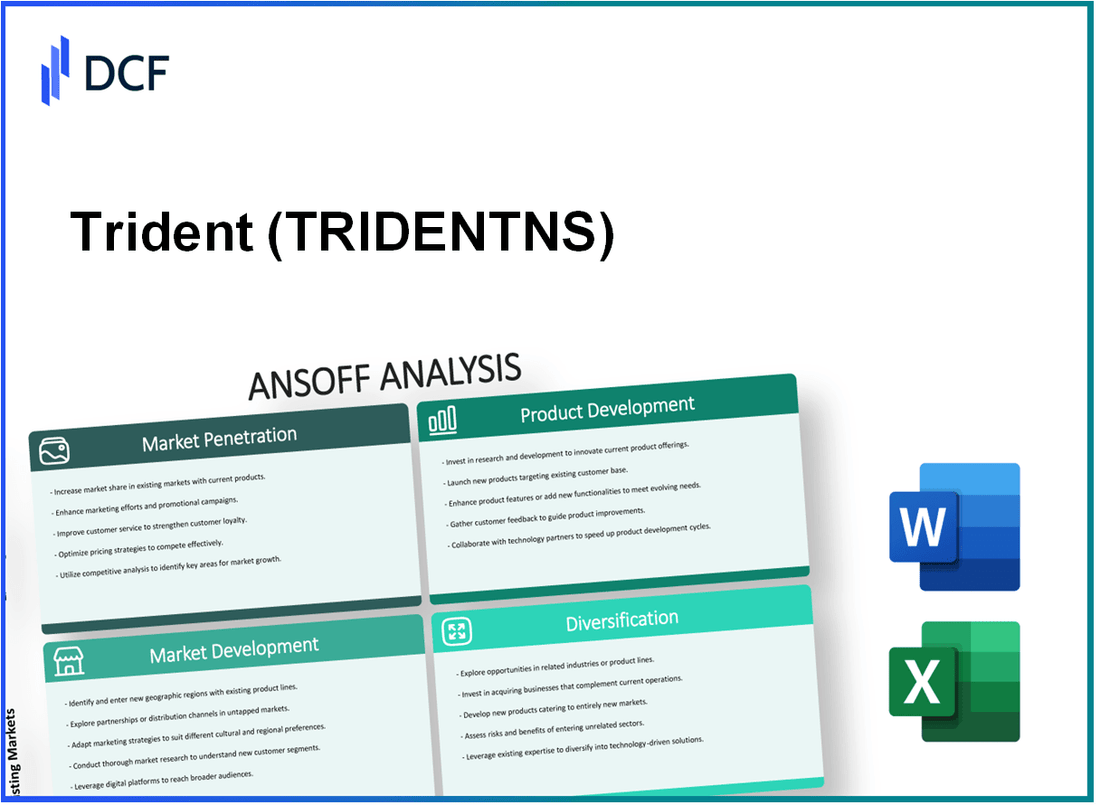
The Ansoff Matrix is a powerful strategic tool that can guide decision-makers and entrepreneurs like those at Trident Limited in navigating the complex waters of business growth. Whether you’re looking to penetrate existing markets or diversify into new territories, understanding the four strategies—Market Penetration, Market Development, Product Development, and Diversification—can help you identify the most promising opportunities. Dive in to explore how each strategy can be applied to fuel Trident Limited's growth journey.
Trident Limited - Ansoff Matrix: Market Penetration
Increase sales of existing products in current markets
Trident Limited reported a revenue of ₹1,972 crores for FY2023, up from ₹1,725 crores in FY2022. This reflects a growth rate of approximately 14.3%. To further increase sales, the company has leveraged its established product lines, including bed and bath textiles, through targeted promotions and enhanced distribution channels. The focus has been on strengthening its presence in existing markets, primarily driven by a surge in e-commerce sales, contributing to approximately 25% of total sales in the recent fiscal year.
Use pricing strategies to attract more customers from competitors
Trident Limited has implemented competitive pricing strategies, offering discounts and bundled pricing on various product categories. The company reported that their average selling price (ASP) for their towel segment decreased by 5% due to these strategies, effectively drawing customers away from competitors. With a market share increase from 12% to 14% in the home textiles sector, this strategy has proven beneficial. The company's elasticity analysis suggests a 7% increase in volume sales with this pricing adjustment.
Enhance marketing efforts to boost brand visibility
In FY2023, Trident Limited increased its marketing expenditure to ₹150 crores, a rise of 20% compared to the previous year. This investment has resulted in a more robust digital marketing campaign, resulting in a 30% increase in social media engagement and a 15% uptick in website traffic. The company's focus on content marketing and influencer partnerships has expanded its reach among younger demographics, significantly impacting brand visibility.
Improve customer service to increase customer retention
Trident Limited has prioritized customer service enhancements, reporting a customer satisfaction rate of 85% in its latest surveys. The introduction of a 24/7 customer support helpline and improved online chat functionality has reduced response times to below 2 minutes. This initiative has contributed to an increase in repeat purchases, which now accounts for 40% of total sales, up from 35% in FY2022.
Encourage existing customers to purchase more frequently
Trident Limited has introduced a loyalty program aimed at increasing purchase frequency. As of FY2023, the program has enrolled over 500,000 customers, leading to a 10% increase in purchase frequency among members. Additionally, targeted email marketing campaigns have improved engagement rates to 25%, pushing existing customers to make purchases more regularly. Financially, the impact of these measures has resulted in a revenue contribution of approximately ₹250 crores from loyalty program participants.
| Metric | FY2022 | FY2023 | % Change |
|---|---|---|---|
| Revenue (₹ crores) | 1,725 | 1,972 | 14.3% |
| Market Share in Home Textiles | 12% | 14% | 16.67% |
| Marketing Expenditure (₹ crores) | 125 | 150 | 20% |
| Customer Satisfaction Rate | 80% | 85% | 6.25% |
| Loyalty Program Enrolled Customers | N/A | 500,000 | N/A |
| Repeat Purchase Rate | 35% | 40% | 14.29% |
| Revenue from Loyalty Program (₹ crores) | N/A | 250 | N/A |
Trident Limited - Ansoff Matrix: Market Development
Expand into new geographical areas with existing product lines
Trident Limited has been strategically expanding its geographical footprint. As of the latest financial reports, the company generated approximately ₹1,300 crore in sales from international markets, representing about 45% of its total revenue in FY 2022-2023. Key focus areas include regions such as Africa and North America, where it aims to increase its market share by leveraging its cotton and home textile product lines.
Target different demographic groups within current regions
The company has introduced specialized product lines aimed at younger demographics, particularly in urban centers. In FY 2022-2023, Trident launched a new range of eco-friendly textiles, catering specifically to the growing market of environmentally conscious consumers. This initiative saw a growth of 20% in sales volume, contributing to an additional revenue of ₹200 crore.
Explore new sales channels like online platforms or partnerships
In an effort to strengthen its online presence, Trident partnered with major e-commerce platforms such as Amazon and Flipkart. As of the first quarter of FY 2023, online sales accounted for 30% of overall sales, amounting to approximately ₹390 crore. This channel is expected to continue growing as more consumers shift to digital purchasing.
Adapt marketing strategies to suit new customer segments
Trident has tailored its marketing strategies to meet the needs of various customer segments. The rebranding campaign targeting millennial consumers led to a significant increase in brand visibility, reflected in a rise of 25% in social media engagement metrics. As a result, the company reported an increase in customer acquisition costs that fell within the range of ₹50-70 per new customer, showcasing effective marketing ROI.
Leverage existing brand strengths to enter new markets
Trident’s established reputation for quality in textiles provides a strong foundation for entering new markets. The company has leveraged this strength to penetrate markets in Southeast Asia, witnessing a revenue growth of 15% from these regions in FY 2023, translating to approximately ₹150 crore in additional sales. The brand's long-standing commitment to sustainability has resonated well with consumers in these emerging markets.
| Strategy | Financial Impact | Market Growth Percentage |
|---|---|---|
| Geographical Expansion | ₹1,300 crore from international sales | 45% |
| Targeting New Demographics | ₹200 crore from eco-friendly textiles | 20% |
| Online Sales Channel | ₹390 crore from e-commerce | 30% |
| Marketing Strategy Adaptation | Cost per customer acquisition: ₹50-70 | 25% increase in engagement |
| Leveraging Brand Strengths | ₹150 crore from Southeast Asia | 15% |
Trident Limited - Ansoff Matrix: Product Development
Introduce new products to existing markets
In FY 2022-23, Trident Limited launched several new products, contributing to a revenue increase of 12% compared to the previous year. Noteworthy introductions included new variants in the home textiles segment, particularly in bed sheets and towels, which generated approximately INR 600 Crore in sales.
Innovate or improve existing product lines to meet customer needs
Trident has invested around INR 100 Crore in the past fiscal year to enhance its existing product lines. The company focused on sustainability by incorporating organic materials, resulting in a 15% increase in the demand for eco-friendly textiles. This initiative has resonated well with environmentally-conscious consumers.
Invest in research and development to stay ahead of market trends
Trident Limited allocated 4% of its total revenue, amounting to approximately INR 80 Crore, to research and development activities in FY 2022-23. This investment aimed to explore advanced manufacturing processes and innovative textile technologies, ensuring the company remains competitive in a rapidly evolving market.
Collaborate with customers for feedback on product improvements
Trident has launched several customer engagement initiatives, receiving feedback from over 15,000 customers through surveys and focus groups. In response, they have implemented changes that improved product satisfaction ratings by 20%, particularly in their towel and bedding ranges.
Offer product variations to cater to specific customer preferences
To cater to diverse customer preferences, Trident has expanded its product variations, introducing over 50 new designs and colors across its product lines. This strategy has led to a sales increase of 18% in their textile category, with specific growth noted in the luxury towel segment, contributing INR 200 Crore to annual revenues.
| Year | Investment in R&D (INR Crore) | Revenue from New Products (INR Crore) | Customer Feedback Participants | Product Variations Introduced |
|---|---|---|---|---|
| 2020-21 | 70 | 450 | 10,000 | 30 |
| 2021-22 | 75 | 500 | 12,000 | 40 |
| 2022-23 | 80 | 600 | 15,000 | 50 |
Trident Limited - Ansoff Matrix: Diversification
Enter new markets with new products
Trident Limited has focused on diversification by entering new markets with innovative products. In FY 2022, Trident achieved revenue growth of 25% in its home textiles segment, fueled by the introduction of new textile products catering to both domestic and international markets. The company's strategy has included launching products such as eco-friendly bed linens and towels, which have been well-received, particularly in North America and Europe.
Explore acquisition opportunities to enter unrelated industries
Trident has been strategic in exploring acquisitions to expand its footprint. In 2021, Trident acquired a 85% stake in a packaging company for approximately ₹150 crore, aiming to diversify into the packaging sector. This acquisition not only helped Trident reduce reliance on its core textiles segment but also allowed it to leverage synergies for cost savings and efficiency in production.
Develop products that leverage existing technologies or capabilities
Leveraging its expertise in textiles, Trident Limited has ventured into the production of technical textiles. The technical textiles segment recorded a revenue growth of 30% in FY 2022, showcasing the company’s capability to innovate and develop high-performance products for industries such as automotive and healthcare. The company's investment in R&D was approximately ₹20 crore in 2022, focused on enhancing the performance of existing technologies.
Balance risk by diversifying product offerings across multiple sectors
Trident Limited has balanced its risk profile by offering a diverse portfolio across various sectors. In FY 2022, the company reported that the home textiles segment accounted for 60% of its total revenue, while the remaining 40% came from the paper and packaging segments. This diversification has helped mitigate risks associated with market fluctuations specific to any single industry.
Establish strategic alliances to leverage new market entries
Trident has formed strategic alliances to enhance its market reach. In 2022, the company entered a partnership with a European retailer, resulting in a 15% increase in exports of its textile products. The alliance enables Trident to utilize the retailer's established distribution channels, facilitating entry into new markets without a significant upfront investment.
| Year | Revenue Growth (%) | Acquisition Cost (₹ Crore) | R&D Investment (₹ Crore) | Product Segment Revenue Share (%) |
|---|---|---|---|---|
| 2021 | 20% | 150 | 15 | Home Textiles: 65% |
| 2022 | 25% | 150 | 20 | Home Textiles: 60% |
| 2023 (Projected) | 30% | - | 25 | Home Textiles: 55% |
The Ansoff Matrix serves as a vital tool for Trident Limited, guiding decision-makers in navigating growth strategies that align with their strengths and market opportunities. By carefully analyzing each quadrant—Market Penetration, Market Development, Product Development, and Diversification—leaders can make informed choices that not only enhance competitive advantage but also foster sustainable growth in an ever-evolving business landscape.
Disclaimer
All information, articles, and product details provided on this website are for general informational and educational purposes only. We do not claim any ownership over, nor do we intend to infringe upon, any trademarks, copyrights, logos, brand names, or other intellectual property mentioned or depicted on this site. Such intellectual property remains the property of its respective owners, and any references here are made solely for identification or informational purposes, without implying any affiliation, endorsement, or partnership.
We make no representations or warranties, express or implied, regarding the accuracy, completeness, or suitability of any content or products presented. Nothing on this website should be construed as legal, tax, investment, financial, medical, or other professional advice. In addition, no part of this site—including articles or product references—constitutes a solicitation, recommendation, endorsement, advertisement, or offer to buy or sell any securities, franchises, or other financial instruments, particularly in jurisdictions where such activity would be unlawful.
All content is of a general nature and may not address the specific circumstances of any individual or entity. It is not a substitute for professional advice or services. Any actions you take based on the information provided here are strictly at your own risk. You accept full responsibility for any decisions or outcomes arising from your use of this website and agree to release us from any liability in connection with your use of, or reliance upon, the content or products found herein.