
|
Trident Limited (TRIDENT.NS) DCF Valuation |
Fully Editable: Tailor To Your Needs In Excel Or Sheets
Professional Design: Trusted, Industry-Standard Templates
Investor-Approved Valuation Models
MAC/PC Compatible, Fully Unlocked
No Expertise Is Needed; Easy To Follow
Trident Limited (TRIDENT.NS) Bundle
No matter if you’re an investor or an analyst, this (TRIDENTNS) DCF Calculator is your go-to resource for accurate valuation. Loaded with real data from Trident Limited, you can easily adjust forecasts and instantly observe the effects.
What You Will Receive
- Pre-Configured Financial Model: Access to Trident Limited’s (TRIDENTNS) actual financial data for accurate DCF valuations.
- Comprehensive Forecast Management: Modify key inputs such as revenue growth, profit margins, WACC, and other essential drivers.
- Real-Time Calculations: Enjoy automatic updates that reflect your changes instantly.
- Professional-Grade Template: A polished Excel spreadsheet crafted for high-quality valuations.
- Flexible and Reusable: Designed for adaptability, allowing for frequent use in detailed forecasting.
Key Features
- Real-Time TRIDENTNS Data: Pre-populated with Trident Limited’s historical performance data and future forecasts.
- Completely Customizable Inputs: Modify revenue growth rates, profit margins, discount rates, tax percentages, and capital expenditure assumptions.
- Adaptive Valuation Model: Instantly refreshes Net Present Value (NPV) and intrinsic value based on your specified criteria.
- Scenario Analysis: Develop various forecasting scenarios to explore different valuation possibilities.
- Intuitive Design: Seamlessly structured for both seasoned professionals and novice users.
How It Operates
- Step 1: Download the prebuilt Excel template featuring Trident Limited's (TRIDENTNS) data.
- Step 2: Navigate through the pre-filled sheets to familiarize yourself with the essential metrics.
- Step 3: Adjust forecasts and assumptions in the editable yellow cells (WACC, growth, margins).
- Step 4: Instantly see the recalculated results, including the intrinsic value of Trident Limited (TRIDENTNS).
- Step 5: Utilize the outputs to make informed investment decisions or create detailed reports.
Why Choose the Trident Limited (TRIDENTNS) Calculator?
- Precision: Utilizes authentic financial data from Trident Limited for reliable results.
- Versatility: Allows users to experiment with and adjust inputs as needed.
- Efficiency: Eliminate the need to create a DCF model from the ground up.
- Expert-Quality: Crafted with the expertise and usability standards expected at the CFO level.
- User-Centric: Intuitive interface that’s accessible even for those new to financial modeling.
Who Can Benefit from Trident Limited (TRIDENTNS)?
- Professional Investors: Construct comprehensive and trustworthy valuation models for portfolio assessments.
- Corporate Finance Teams: Evaluate valuation scenarios to inform internal strategic decisions.
- Consultants and Advisors: Deliver precise valuation insights on Trident Limited (TRIDENTNS) to clients.
- Students and Educators: Utilize real-world data to enhance the practice and instruction of financial modeling.
- Tech Enthusiasts: Gain insights into how tech companies like Trident Limited (TRIDENTNS) are appraised in the financial market.
Contents of the Template
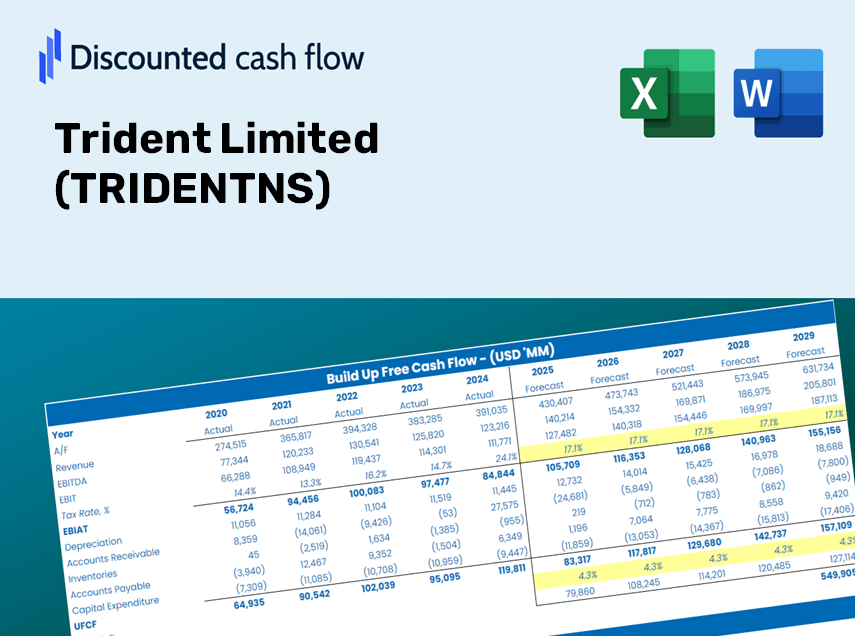
- Operating and Balance Sheet Data: Pre-filled historical data and forecasts for Trident Limited (TRIDENTNS), including revenue, EBITDA, EBIT, and capital expenditures.
- WACC Calculation: A dedicated sheet for calculating the Weighted Average Cost of Capital (WACC), featuring parameters such as Beta, risk-free rate, and share price.
- DCF Valuation (Unlevered and Levered): Customizable Discounted Cash Flow models that present the intrinsic value with comprehensive calculations.
- Financial Statements: Pre-loaded annual and quarterly financial statements for Trident Limited (TRIDENTNS) to facilitate in-depth analysis.
- Key Ratios: A selection of profitability, leverage, and efficiency ratios relevant to Trident Limited (TRIDENTNS).
- Dashboard and Charts: A visual summary of valuation outputs and underlying assumptions for easy analysis of results.
Disclaimer
All information, articles, and product details provided on this website are for general informational and educational purposes only. We do not claim any ownership over, nor do we intend to infringe upon, any trademarks, copyrights, logos, brand names, or other intellectual property mentioned or depicted on this site. Such intellectual property remains the property of its respective owners, and any references here are made solely for identification or informational purposes, without implying any affiliation, endorsement, or partnership.
We make no representations or warranties, express or implied, regarding the accuracy, completeness, or suitability of any content or products presented. Nothing on this website should be construed as legal, tax, investment, financial, medical, or other professional advice. In addition, no part of this site—including articles or product references—constitutes a solicitation, recommendation, endorsement, advertisement, or offer to buy or sell any securities, franchises, or other financial instruments, particularly in jurisdictions where such activity would be unlawful.
All content is of a general nature and may not address the specific circumstances of any individual or entity. It is not a substitute for professional advice or services. Any actions you take based on the information provided here are strictly at your own risk. You accept full responsibility for any decisions or outcomes arising from your use of this website and agree to release us from any liability in connection with your use of, or reliance upon, the content or products found herein.