
|
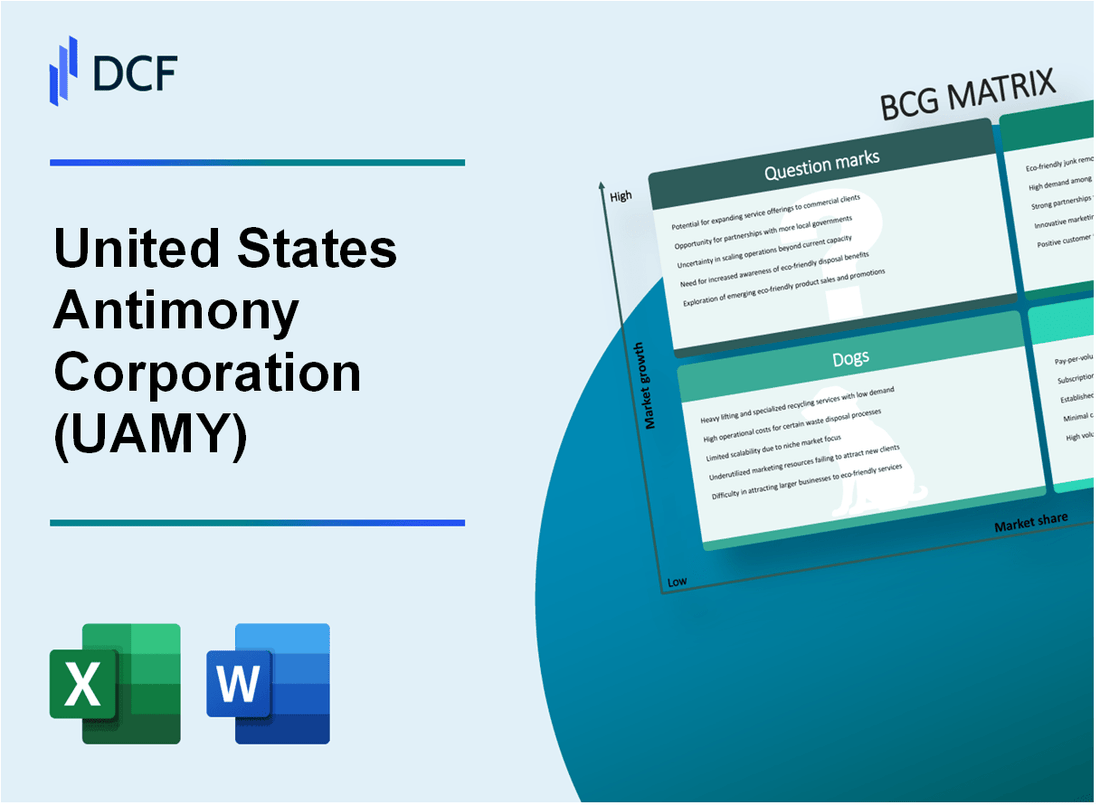
United States Antimony Corporation (UAMY): BCG Matrix [Dec-2025 Updated] |
Fully Editable: Tailor To Your Needs In Excel Or Sheets
Professional Design: Trusted, Industry-Standard Templates
Investor-Approved Valuation Models
MAC/PC Compatible, Fully Unlocked
No Expertise Is Needed; Easy To Follow
United States Antimony Corporation (UAMY) Bundle
You're looking at United States Antimony Corporation (UAMY) right now, and honestly, it's a fascinating pivot point as they shift from a simple commodity player to a critical domestic supplier. We're mapping their portfolio-from the established antimony operations that generated a solid 28% gross margin to fund expansion, to the high-stakes exploration bets in cobalt and tungsten-onto the BCG Matrix. With antimony prices hitting US$51,500/ton in 2025 and a massive $245 million defense contract secured, the core question isn't if the company is changing, but how this portfolio balances its reliable cash generation against its aggressive, high-reward future. See below to find out which segments are the Stars and which are currently the Dogs.
Background of United States Antimony Corporation (UAMY)
You're looking at United States Antimony Corporation (UAMY) as of late 2025, and the story is one of a significant, operationally-driven turnaround, fueled by critical mineral demand. The company has positioned itself as the only domestic processor and producer of antimony products in the United States, a role that has gained national importance given geopolitical supply shifts. This strategic placement is key to understanding their recent financial trajectory.
Financially, the momentum in the first half of 2025 was strong. United States Antimony Corporation delivered year-over-year revenue growth of 160% in the first six months, hitting $17.5 million in revenue. Gross profit during that same period rose even faster, up 183% year-over-year, with gross margins expanding from the 24% range to near 30% in some reports, showing operational efficiency gains. Net income for the first half of the year soared to $728,000, a 707% jump from the prior year.
However, the third quarter brought some mixed signals, particularly around earnings per share, though revenue for the nine months ending September 30, 2025, reached $26.2 million. The antimony segment itself was the core driver, generating $23.57 million in sales over those nine months, representing a 235% increase year-over-year. Despite this top-line strength, the company reported a net loss of nearly $4.8 million for Q3 2025 on a GAAP basis, a stark contrast to the prior year's Q3 loss of about $729,000.
Operationally, United States Antimony Corporation is making tangible moves to secure supply. They have begun extracting bulk samples at Stibnite Hill in Montana, marking the first U.S. antimony mining in roughly 40 years, with expected ore grades over 10% antimony. Furthermore, they completed the refurbishment of four furnaces at their Thompson Falls facility, intending to double processing output. The company also bolstered its balance sheet, ending the first half of 2025 with cash and investments totaling $38.5 million and minimal long-term debt, giving them flexibility.
The strategic outlook is anchored by major contract wins that de-risk future revenue from spot market volatility. This includes a significant supply agreement valued at $106.7M with a U.S. industrial fabric manufacturer for antimony trioxide, reinforcing their role in the flame retardant market. They also secured an initial $10 million order for the National Defense Stockpile. Management is projecting an exponential leap in revenue for 2026, guiding toward $125 million, up from an estimated $40 million to $43 million for the full fiscal year 2025.
United States Antimony Corporation (UAMY) - BCG Matrix: Stars
You're looking at the core growth engine for United States Antimony Corporation (UAMY) right now, the segment that commands the market and is consuming capital to fuel its expansion. In the BCG framework, these are the Stars, and for UAMY, the Antimony segment fits this description perfectly due to its dominant position in a strategically vital, high-growth market.
The market share position is cemented by the fact that United States Antimony Corporation operates the only two smelters in North America capable of processing the metal. Furthermore, it is the only domestic producer of military-spec antimony, which secures a high relative share in a critical national security market. This leadership is underscored by the recent five-year sole-source contract from the U.S. Defense Logistics Agency (DLA) worth up to $245 million for antimony metal ingots. To put that in perspective, that contract value is nearly 17 times the company's total reported revenue of $14.9 million for fiscal year 2024.
This segment is operating in a high-growth environment, evidenced by the massive revenue acceleration. Revenues for the first nine months of 2025 reached $26.23 million, marking a 182% increase compared to the first nine months of 2024. Management is projecting this growth trajectory to continue, raising the fiscal year 2026 revenue guidance to $125 Million.
Because Stars are in a high-growth market, they require significant investment to maintain that lead, which is exactly what United States Antimony Corporation is doing. The company is executing a substantial expansion of its Thompson Falls, Montana antimony processing facility, which began in May 2025. This enhancement aims to magnify the processing capacity by over 400%.
Here are the key capacity and investment metrics driving this Star segment:
- Expansion aims to boost output from 100 tons per month to 500 tons per month.
- This planned increase represents a five times increase in output.
- New furnaces are expected to be operational in January 2026.
- The company is also advancing mining operations in Alaska, with expected start in the second quarter of 2026.
The strategy here is clear: invest heavily now to solidify the market leadership, turning this high-growth, high-share unit into a future Cash Cow when the market growth inevitably slows. The sheer scale of the DLA commitment makes this a mission-critical operation for the company's near-term financial health.
You can see the planned capacity shift against the backdrop of recent performance in this table:
| Metric | Value/Period | Context/Date |
| DLA Contract Value | $245 million | Five-year agreement, sole-source |
| 2024 Revenue | $14.9 million | Pre-contract scale |
| Antimony Smelters in North America | Two | Only ones with long-standing capacity |
| Montana Capacity (Pre-Expansion) | 100 tons/month | Prior to May 2025 expansion start |
| Montana Capacity (Target) | 500 tons/month | Post-expansion target for January 2026 |
| 2025 Revenue Guidance (Narrowed) | $40 - $43 Million | As of November 2025 |
| 2026 Revenue Guidance | $125 Million | Reiterated forecast |
United States Antimony Corporation (UAMY) - BCG Matrix: Cash Cows
You're looking at the core engine of United States Antimony Corporation (UAMY), the segment that, under the BCG framework, represents a high market share in a mature, yet currently high-demand, market. This is where the company generates the necessary liquidity to fund riskier ventures.
The antimony processing operations are definitely the anchor here, generating $23.57 million in sales for the first nine months of 2025. This segment is the primary cash generator, even though the overall company reported a consolidated net loss of $4.05 million for the same nine months, a loss heavily influenced by $5.18 million in non-cash expenses, primarily share-based compensation.
We see clear evidence of milking this position through margin expansion. The gross margin saw a strong improvement to 28% for the nine months ended September 30, 2025, up from 24% during the same nine months last year. This margin strength, which is before processing any of the in-house mined antimony, confirms the high-margin nature of the current sales mix.
Here's a quick look at the financial performance underpinning this Cash Cow status:
| Metric | Value (9M Ended Sept 30, 2025) |
| Antimony Segment Sales | $23.57 million |
| Gross Margin | 28% |
| Total Consolidated Revenue | $26.23 million |
| Cash and Investments | $38.5 million |
The growth in this segment, which saw antimony sales increase by 235% year-over-year for the nine-month period, was primarily fueled by an increase in the average sales price per pound, not necessarily increased volumes. This price leverage in a relatively stable operational setting is what creates the cash surplus. The company is capitalizing on market conditions to maximize returns from its established processing capability.
The production side shows a consistent, if not rapidly expanding, baseline capacity, which is typical for a Cash Cow needing minimal new investment to maintain output. The current stable production volume averages about 100 tonnes a month, providing that consistent cash flow you expect from this quadrant. [cite: User Outline]
This cash generation is substantial enough to support the rest of the portfolio. The balance sheet reflects this strength, with substantial cash and investments of $38.5 million at Q3 2025. This liquidity, which includes investment in securities like federal bonds, is crucial capital for funding the high-growth Question Mark projects, such as the smelter expansion which was about 65% complete as of Q3 2025. You want to keep this unit running efficiently; any investment here should focus on infrastructure that boosts efficiency, not necessarily market share expansion, as that's already established.
The key operational characteristics supporting the Cash Cow thesis include:
- Antimony sales driving the majority of revenue.
- Gross margin expansion confirming pricing power.
- Significant cash reserves available for deployment.
- Zeolite segment providing a smaller, stable revenue stream.
Finance: review the Q4 cash flow projections based on the 28% gross margin holding steady. [Finance Owner]
United States Antimony Corporation (UAMY) - BCG Matrix: Dogs
Dogs, are units or products with a low market share and low growth rates. They frequently break even, neither earning nor consuming much cash. Dogs are generally considered cash traps because businesses have money tied up in them, even though they bring back almost nothing in return. These business units are prime candidates for divestiture.
For United States Antimony Corporation, the Dog quadrant is characterized by operations that are stable but do not drive the primary growth narrative, which is currently dominated by the Antimony segment. These units require minimal strategic investment but offer limited upside.
The Precious Metals segment, which involves the recovery of gold and silver at the Montana facility, is explicitly a low-volume byproduct of the main antimony processing stream. This operation is ancillary and holds a low relative market share in the much broader precious metals market. Based on the nine-month figures for 2025, this segment contributes negligibly to the top line.
The Zeolite business, while showing positive momentum, fits the Dog profile due to its minor contribution relative to the core business. You saw that the Zeolite segment generated $2.65 million in sales for the first nine months of 2025, representing a 16% year-over-year increase. This growth is steady but far more modest than the core Antimony segment's performance, which generated $23.57 million in sales over the same nine-month period.
These low-growth, low-share operations are typically low-margin and non-core, requiring minimal capital expenditure to maintain operations, but they offer limited potential to significantly alter the company's overall financial trajectory. They are stable contributors that should be managed for cash neutrality rather than aggressive expansion.
Here's the quick math on the segment revenue contribution for the first nine months ending September 30, 2025, which clearly illustrates the hierarchy of importance:
| Segment | Revenue (9M 2025) | YOY Growth (Approximate) |
| Antimony Segment | $23.57 million | 235% |
| Zeolite Segment | $2.65 million | 16% |
| Precious Metals Segment (Calculated) | $0.007 million (or $7,000) | Not specified |
The calculated revenue for the Precious Metals segment, derived by subtracting the Antimony and Zeolite revenues from the total reported revenue of $26.227 million for the nine months ending September 30, 2025, confirms its status as a minimal byproduct stream.
The characteristics defining these Dog units for United States Antimony Corporation include:
- Precious Metals recovery is a low-volume byproduct.
- Zeolite revenue was $2.65 million in 9M 2025.
- Zeolite segment growth was 16% year-over-year.
- Antimony segment dwarfs both, with $23.57 million in sales.
- Operations require minimal investment for maintenance only.
United States Antimony Corporation (UAMY) - BCG Matrix: Question Marks
The Question Marks quadrant for United States Antimony Corporation represents business units or projects operating in high-growth markets but currently holding a low relative market share, thus consuming significant cash while awaiting a decisive investment strategy to either capture market share or be divested. These are the high-potential, high-cash-burn areas of the business as of late 2025.
New Critical Mineral Exploration and Diversification
United States Antimony Corporation advanced multiple exploration programs across Alaska and Ontario during 2025, targeting antimony, cobalt, and tungsten, which are all critical minerals experiencing surging demand. This expansion into new geographies and minerals requires upfront capital expenditure before any revenue stream is established from these specific efforts. The company is planning to start mining in Alaska in the second quarter of 2026.
The acquisition of the Fostung Tungsten Property in Ontario exemplifies this high-growth, low-share positioning. The purchase price was $5 million in cash, plus a 0.5% Net Smelter Return (NSR) royalty. This move targets the tungsten market, where annual demand in the USA and Canada exceeds $1 billion, yet there has been no commercial production in either country since 2016, with China controlling 80-85% of global processing capacity. The Fostung Property holds an inferred resource of 12.4 million tonnes grading 0.213% tungsten trioxide.
Here are the key metrics of the Fostung Tungsten Property acquisition:
| Metric | Value |
| Cash Consideration Paid | $5,000,000 |
| Inferred Resource (Tonnes) | 12.4 million |
| Tungsten Trioxide Grade | 0.213% |
| United States/Canada Annual Demand | Over $1 billion |
| China Global Processing Share | 80-85% |
Restoration of Domestic Antimony Mining
The restoration of domestic antimony mining at Stibnite Hill, Montana, is a high-risk, high-reward capital project essential for securing domestic supply chains, particularly for defense applications. The company received Montana Department of Environmental Quality approval to modify its operating plan on October 2, 2025, and began mechanized exploration and bulk sampling on October 7, 2025.
The initial results suggest high potential, as ore grades are expected to exceed 10% antimony. Over 250 tons of stibnite ore have already been hauled to a flotation mill for assay. Management anticipates margins on this self-mined feed will be about three times higher than purchasing from third parties. However, this is still in the early ramp-up phase, with new furnaces at the Thompson Falls facility expected to be operational in January 2026. The current nine-month period ending September 30, 2025, shows a net loss of $4.05 million, illustrating the cash consumption of these development efforts.
- Montana DEQ approval date: October 2, 2025
- Bulk sampling start date: October 7, 2025
- Tons of ore hauled to mill: Over 250 tons
- Expected margin improvement factor: Three times higher
- New furnaces operational target: January 2026
The Volume Commitment of the Industrial Trioxide Agreement
The execution of the five-year supply agreement for antimony trioxide with an unnamed U.S. industrial fabric manufacturer is a major strategic win, but it creates an immediate need for increased production volume, characteristic of a Question Mark needing investment to become a Star. The definitive contract term is five years, valued at up to $106.7 million in the first five-year term, with an option for renewal up to five additional years.
This agreement reinforces the need to ramp up capacity from the newly secured domestic feed and expanded processing facilities. The company has reaffirmed its 2026 revenue guidance at $125 million, a significant leap from the narrowed 2025 guidance of $40 million to $43 million. Fulfilling the volume required by this $106.7 million contract is the primary driver for this projected growth, demanding heavy near-term investment in mining and processing throughput.
The financial context for these growth initiatives shows the current cash burn:
- Nine Months Ended September 30, 2025 Net Loss: $4.05 million
- Nine Months Ended September 30, 2025 Revenue: $26.23 million (up 182% YOY)
- Cash and Investments as of September 30, 2025: $38.5 million
- Projected 2026 Revenue Target: $125 million
Disclaimer
All information, articles, and product details provided on this website are for general informational and educational purposes only. We do not claim any ownership over, nor do we intend to infringe upon, any trademarks, copyrights, logos, brand names, or other intellectual property mentioned or depicted on this site. Such intellectual property remains the property of its respective owners, and any references here are made solely for identification or informational purposes, without implying any affiliation, endorsement, or partnership.
We make no representations or warranties, express or implied, regarding the accuracy, completeness, or suitability of any content or products presented. Nothing on this website should be construed as legal, tax, investment, financial, medical, or other professional advice. In addition, no part of this site—including articles or product references—constitutes a solicitation, recommendation, endorsement, advertisement, or offer to buy or sell any securities, franchises, or other financial instruments, particularly in jurisdictions where such activity would be unlawful.
All content is of a general nature and may not address the specific circumstances of any individual or entity. It is not a substitute for professional advice or services. Any actions you take based on the information provided here are strictly at your own risk. You accept full responsibility for any decisions or outcomes arising from your use of this website and agree to release us from any liability in connection with your use of, or reliance upon, the content or products found herein.