
|
United Community Banks, Inc. (UCB) DCF Valuation |
Fully Editable: Tailor To Your Needs In Excel Or Sheets
Professional Design: Trusted, Industry-Standard Templates
Investor-Approved Valuation Models
MAC/PC Compatible, Fully Unlocked
No Expertise Is Needed; Easy To Follow
United Community Banks, Inc. (UCB) Bundle
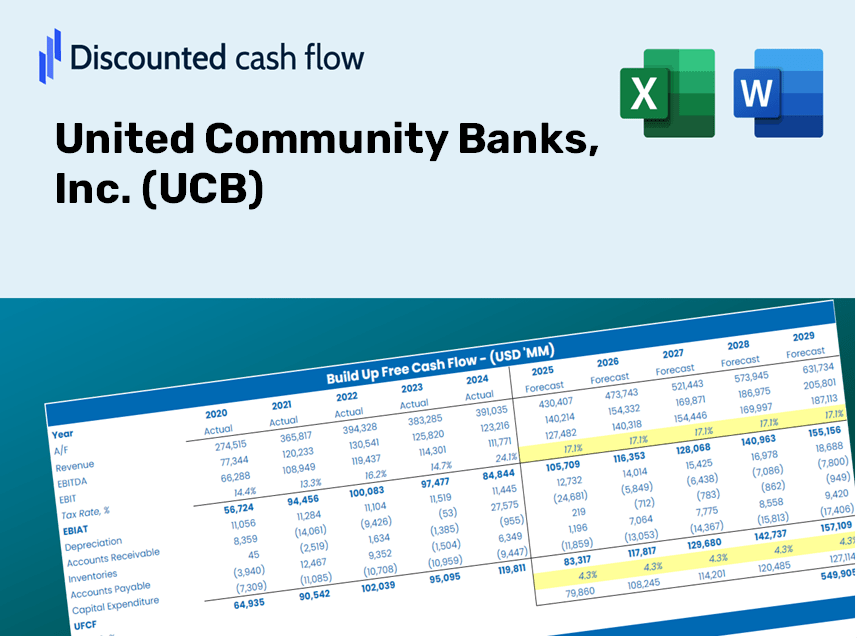
As an investor or analyst, this [UCB] DCF Calculator is your go-to resource for accurate valuation. Loaded with real data from United Community Banks, Inc., you can adjust forecasts and immediately observe the results.
Benefits You Will Receive
- Authentic UCB Data: Preloaded financials – encompassing revenue to EBIT – based on actual and projected figures.
- Comprehensive Customization: Modify all essential parameters (yellow cells) such as WACC, growth %, and tax rates.
- Immediate Valuation Adjustments: Automatic recalculations to assess the effects of changes on UCB’s fair value.
- Flexible Excel Template: Designed for quick modifications, scenario analysis, and thorough projections.
- Efficient and Precise: Eliminate the need to create models from the ground up while ensuring accuracy and adaptability.
Key Features
- Comprehensive DCF Calculator: Features robust unlevered and levered DCF valuation models tailored for United Community Banks, Inc. (UCB).
- WACC Calculator: Offers a user-friendly Weighted Average Cost of Capital sheet with adjustable parameters.
- Customizable Forecast Assumptions: Easily adjust growth rates, capital expenditures, and discount rates to suit your analysis.
- Integrated Financial Ratios: Evaluate profitability, leverage, and efficiency ratios specifically for United Community Banks, Inc. (UCB).
- Interactive Dashboard and Charts: Visual representations of vital valuation metrics facilitate straightforward analysis.
How It Functions
- Step 1: Download the Excel spreadsheet.
- Step 2: Examine the pre-filled United Community Banks, Inc. (UCB) data (both historical and forecasted).
- Step 3: Modify the key assumptions (highlighted in yellow) according to your analysis.
- Step 4: Observe the automatic updates reflecting United Community Banks, Inc.'s (UCB) intrinsic value.
- Step 5: Utilize the results for your investment strategies or financial reporting.
Why Opt for This Calculator?
- Designed for Experts: A sophisticated tool utilized by analysts, CFOs, and financial consultants.
- Comprehensive Data: UCB’s historical and projected financials are preloaded for enhanced reliability.
- Scenario Analysis: Effortlessly simulate various forecasts and assumptions.
- Transparent Results: Automatically calculates intrinsic value, NPV, and essential metrics.
- User-Friendly: Step-by-step guidance will walk you through the entire process.
Who Can Benefit from This Product?
- Institutional Investors: Develop comprehensive and dependable valuation models for evaluating UCB's portfolio.
- Corporate Finance Departments: Examine valuation scenarios to inform internal decision-making strategies for UCB.
- Financial Consultants and Advisors: Supply clients with precise valuation analyses for United Community Banks, Inc. (UCB) stock.
- Academics and Students: Utilize real-time data to enhance learning and practice in financial modeling related to UCB.
- Banking Enthusiasts: Gain insights into how financial institutions like United Community Banks, Inc. (UCB) are assessed in the market.
Contents of the Template
- Detailed DCF Model: An editable template featuring comprehensive valuation calculations.
- Actual Financial Data: United Community Banks, Inc. (UCB)’s historical and projected financials preloaded for thorough analysis.
- Customizable Assumptions: Modify WACC, growth rates, and tax assumptions to explore various scenarios.
- Financial Statements: Complete annual and quarterly breakdowns for enhanced insights.
- Essential Ratios: Integrated analysis for profitability, efficiency, and leverage metrics.
- Interactive Dashboard: Visual outputs, including charts and tables, presenting clear and actionable results.
Disclaimer
All information, articles, and product details provided on this website are for general informational and educational purposes only. We do not claim any ownership over, nor do we intend to infringe upon, any trademarks, copyrights, logos, brand names, or other intellectual property mentioned or depicted on this site. Such intellectual property remains the property of its respective owners, and any references here are made solely for identification or informational purposes, without implying any affiliation, endorsement, or partnership.
We make no representations or warranties, express or implied, regarding the accuracy, completeness, or suitability of any content or products presented. Nothing on this website should be construed as legal, tax, investment, financial, medical, or other professional advice. In addition, no part of this site—including articles or product references—constitutes a solicitation, recommendation, endorsement, advertisement, or offer to buy or sell any securities, franchises, or other financial instruments, particularly in jurisdictions where such activity would be unlawful.
All content is of a general nature and may not address the specific circumstances of any individual or entity. It is not a substitute for professional advice or services. Any actions you take based on the information provided here are strictly at your own risk. You accept full responsibility for any decisions or outcomes arising from your use of this website and agree to release us from any liability in connection with your use of, or reliance upon, the content or products found herein.