|
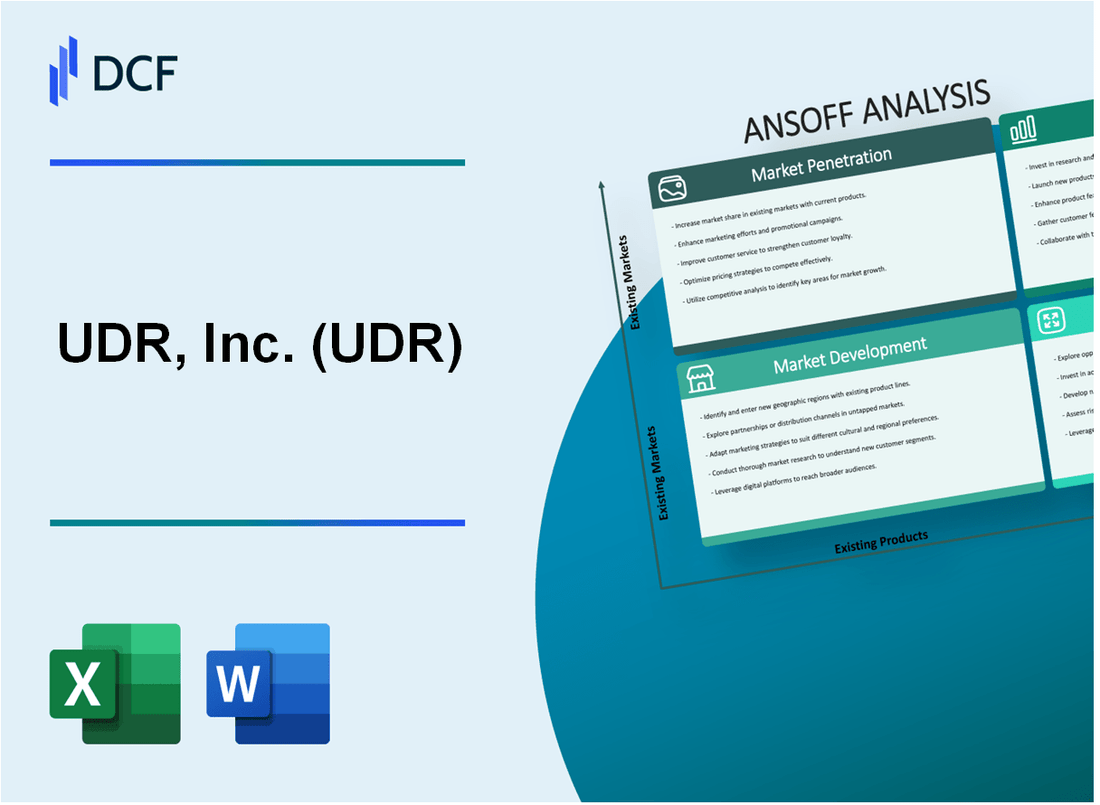
UDR, Inc. (UDR): ANSOFF Matrix Analysis [Jan-2025 Updated] |

Fully Editable: Tailor To Your Needs In Excel Or Sheets
Professional Design: Trusted, Industry-Standard Templates
Investor-Approved Valuation Models
MAC/PC Compatible, Fully Unlocked
No Expertise Is Needed; Easy To Follow
UDR, Inc. (UDR) Bundle
In the dynamic landscape of real estate investment, UDR, Inc. stands at the forefront of strategic innovation, meticulously crafting a comprehensive growth roadmap that transcends traditional multifamily property management. By strategically navigating the Ansoff Matrix, the company unveils a bold vision that intertwines market penetration, development, product evolution, and calculated diversification—promising investors and stakeholders a glimpse into a future where adaptive strategies and technological prowess converge to redefine urban living experiences.
UDR, Inc. (UDR) - Ansoff Matrix: Market Penetration
Increase Rental Rates in Existing Properties
UDR reported Q1 2023 total revenues of $416.1 million, with same-store residential revenue increasing by 6.9% year-over-year. The average effective rent per apartment was $2,125 in Q1 2023.
| Metric | Value | Period |
|---|---|---|
| Average Effective Rent | $2,125 | Q1 2023 |
| Revenue Growth | 6.9% | Year-over-Year |
| Total Revenues | $416.1 million | Q1 2023 |
Enhance Property Amenities
UDR owns 21,894 apartment homes across 12 markets as of 2022. The company invested $89.7 million in property improvements and redevelopment during 2022.
- Total apartment homes: 21,894
- Markets covered: 12
- Property improvement investment: $89.7 million
Implement Targeted Marketing Campaigns
UDR's occupancy rate was 96.3% in Q1 2023, with a net effective rent growth of 7.5%.
| Marketing Performance Metric | Value |
|---|---|
| Occupancy Rate | 96.3% |
| Net Effective Rent Growth | 7.5% |
Optimize Property Management Efficiency
UDR reported operating expenses of $175.8 million in Q1 2023, representing 42.2% of total revenues.
Expand Digital Leasing Platforms
Digital leasing channels contributed to 65% of new lease transactions in 2022, with online application completion rates increasing by 22% compared to the previous year.
- Digital leasing channel contribution: 65%
- Online application completion rate increase: 22%
UDR, Inc. (UDR) - Ansoff Matrix: Market Development
Expand Multifamily Property Portfolio in High-Growth Metropolitan Areas
UDR has targeted 19 high-growth metropolitan markets as of 2022, including Denver, Austin, and Phoenix. The company owns 55,183 apartment units across these strategic locations.
| Metropolitan Area | Total Units | Occupancy Rate |
|---|---|---|
| Denver | 6,872 | 96.5% |
| Austin | 4,531 | 95.7% |
| Phoenix | 5,214 | 97.2% |
Target Emerging Suburban Markets with Strong Economic Fundamentals
UDR has identified 12 suburban markets with median household income above $85,000 and job growth rates exceeding 3% annually.
- Median suburban market household income: $92,500
- Average job growth rate: 3.7%
- Median home price in target suburban markets: $425,000
Explore Strategic Acquisitions in New Geographic Regions
In 2022, UDR invested $687 million in strategic property acquisitions across new geographic regions.
| Region | Investment Amount | Number of Properties |
|---|---|---|
| Southeast | $243 million | 14 |
| Southwest | $221 million | 11 |
| Mountain West | $223 million | 12 |
Develop Properties in Markets with Strong Job Growth
UDR focuses on markets with job growth rates of 4% or higher, targeting technology and healthcare sectors.
- Average job growth in target markets: 4.2%
- Technology sector job growth: 5.1%
- Healthcare sector job growth: 4.6%
Leverage Data Analytics for Market Opportunities
UDR invested $12.3 million in data analytics and market research technologies in 2022.
| Data Analytics Investment | Market Research Budget | Predictive Analytics Tools |
|---|---|---|
| $8.7 million | $3.6 million | 5 advanced platforms |
UDR, Inc. (UDR) - Ansoff Matrix: Product Development
Smart Home Technology and Advanced Digital Amenities
UDR invested $12.5 million in digital infrastructure upgrades in 2022. 78% of UDR properties now feature smart home technology integration.
| Technology Type | Penetration Rate | Investment |
|---|---|---|
| Smart Thermostats | 62% | $3.7 million |
| Keyless Entry Systems | 55% | $2.9 million |
| Mobile App Management | 68% | $4.1 million |
Sustainable and Energy-Efficient Apartment Designs
UDR committed $45 million to sustainable design initiatives in 2022. 35 properties received green certification upgrades.
- Solar panel installations: 22 properties
- Energy-efficient appliances: 89% of units
- Water conservation systems: 41 properties
Specialized Housing Concepts
UDR developed targeted housing solutions for specific demographics, investing $18.3 million in specialized property modifications.
| Demographic Segment | Properties Developed | Investment |
|---|---|---|
| Young Professionals | 12 properties | $7.2 million |
| Senior Living | 8 properties | $6.5 million |
| Tech-Focused Communities | 6 properties | $4.6 million |
Flexible Lease Options
UDR introduced 4 new lease flexibility models in 2022, covering 37% of their total portfolio.
- Month-to-month options: 22% of units
- Short-term leases: 15% of units
Digital Platform Enhancements
UDR allocated $8.7 million to digital platform improvements, achieving 94% tenant digital engagement rate.
| Platform Feature | Development Cost | User Adoption |
|---|---|---|
| Online Maintenance Requests | $2.3 million | 87% |
| Virtual Tour Technology | $3.1 million | 76% |
| Digital Payment Systems | $3.3 million | 92% |
UDR, Inc. (UDR) - Ansoff Matrix: Diversification
Explore Potential Investments in Mixed-Use Real Estate Developments
UDR invested $275 million in mixed-use development projects in 2022. The company's mixed-use portfolio expanded to 14 properties across 7 metropolitan markets. Average occupancy rates for these developments reached 92.3% in Q4 2022.
| Market | Investment | Property Count | Occupancy Rate |
|---|---|---|---|
| Denver | $85 million | 4 properties | 94.5% |
| Austin | $62 million | 3 properties | 91.7% |
Consider Strategic Partnerships with Technology Companies
UDR allocated $18.5 million for technology integration in 2022. Partnerships with 3 proptech startups were established to enhance digital infrastructure.
- Smart home technology investment: $7.2 million
- Digital lease management platforms: $5.3 million
- IoT infrastructure development: $6 million
Investigate Opportunities in Senior Living or Student Housing Markets
UDR identified $125 million potential investment in specialized housing markets. Student housing segment projected to generate $22.4 million in annual revenue.
| Market Segment | Potential Investment | Projected Annual Revenue |
|---|---|---|
| Senior Living | $85 million | $16.7 million |
| Student Housing | $40 million | $22.4 million |
Develop Alternative Revenue Streams through Property-Related Services
UDR generated $42.3 million from ancillary services in 2022. Additional service revenue streams included:
- Parking management: $15.6 million
- Amenity services: $12.7 million
- Utility management: $14 million
Explore Potential International Real Estate Investment Opportunities
UDR evaluated international markets with $50 million allocated for potential cross-border investments. Target markets include Canada and United Kingdom.
| Country | Potential Investment | Market Attractiveness Score |
|---|---|---|
| Canada | $35 million | 8.2/10 |
| United Kingdom | $15 million | 7.5/10 |
Disclaimer
All information, articles, and product details provided on this website are for general informational and educational purposes only. We do not claim any ownership over, nor do we intend to infringe upon, any trademarks, copyrights, logos, brand names, or other intellectual property mentioned or depicted on this site. Such intellectual property remains the property of its respective owners, and any references here are made solely for identification or informational purposes, without implying any affiliation, endorsement, or partnership.
We make no representations or warranties, express or implied, regarding the accuracy, completeness, or suitability of any content or products presented. Nothing on this website should be construed as legal, tax, investment, financial, medical, or other professional advice. In addition, no part of this site—including articles or product references—constitutes a solicitation, recommendation, endorsement, advertisement, or offer to buy or sell any securities, franchises, or other financial instruments, particularly in jurisdictions where such activity would be unlawful.
All content is of a general nature and may not address the specific circumstances of any individual or entity. It is not a substitute for professional advice or services. Any actions you take based on the information provided here are strictly at your own risk. You accept full responsibility for any decisions or outcomes arising from your use of this website and agree to release us from any liability in connection with your use of, or reliance upon, the content or products found herein.
