
|
UMH Properties, Inc. (UMH) DCF Valuation |
Fully Editable: Tailor To Your Needs In Excel Or Sheets
Professional Design: Trusted, Industry-Standard Templates
Investor-Approved Valuation Models
MAC/PC Compatible, Fully Unlocked
No Expertise Is Needed; Easy To Follow
UMH Properties, Inc. (UMH) Bundle
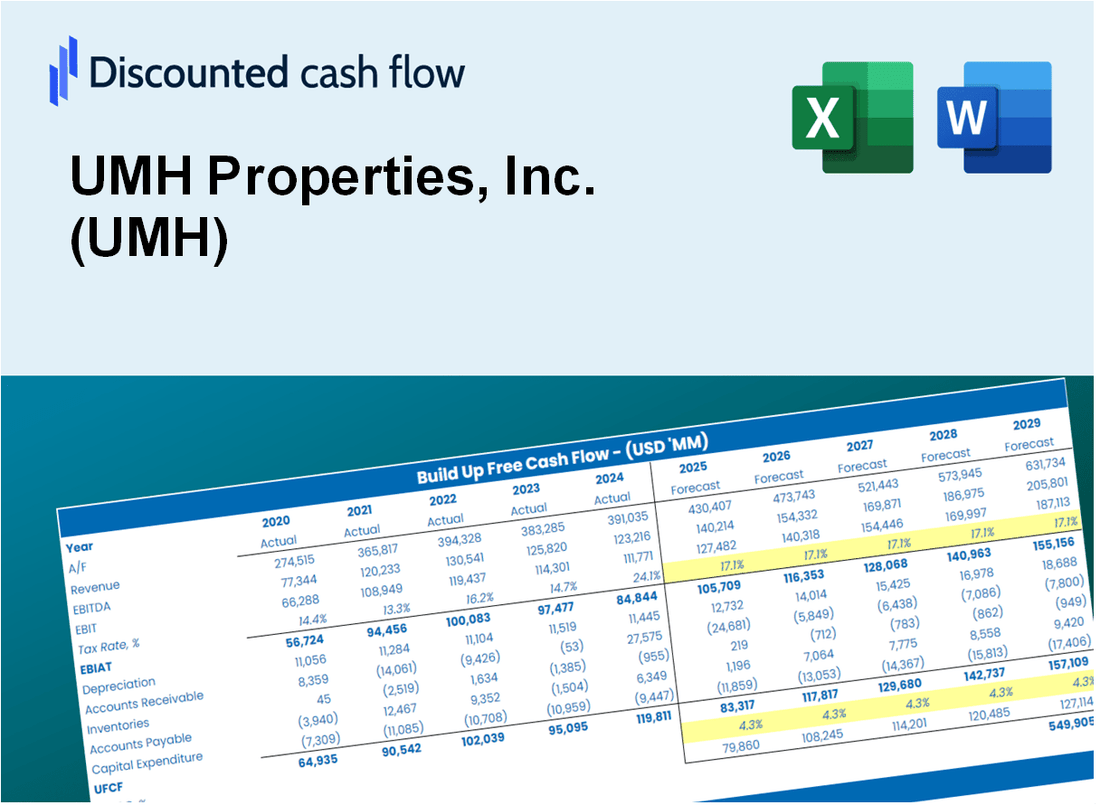
Streamline your analysis and improve precision with our UMH DCF Calculator! Utilizing real data from UMH Properties, Inc. (UMH) and customizable assumptions, this tool empowers you to forecast, analyze, and assess UMH like a seasoned investor.
What You Will Get
- Editable Excel Template: A fully customizable Excel-based DCF Calculator with pre-filled real UMH financials.
- Real-World Data: Historical data and forward-looking estimates (as shown in the yellow cells).
- Forecast Flexibility: Change forecast assumptions like revenue growth, EBITDA %, and WACC.
- Automatic Calculations: Instantly see the impact of your inputs on UMH Properties’ valuation.
- Professional Tool: Built for investors, CFOs, consultants, and financial analysts.
- User-Friendly Design: Structured for clarity and ease of use, with step-by-step instructions.
Key Features
- Comprehensive DCF Calculator: Offers detailed unlevered and levered DCF valuation models tailored for UMH Properties, Inc. (UMH).
- WACC Calculator: Features a pre-built Weighted Average Cost of Capital sheet with adjustable inputs specific to UMH.
- Customizable Forecast Assumptions: Easily modify growth rates, capital expenditures, and discount rates to fit UMH’s financial outlook.
- Integrated Financial Ratios: Assess profitability, leverage, and efficiency ratios relevant to UMH Properties, Inc. (UMH).
- Interactive Dashboard and Charts: Visual representations summarize key valuation metrics for streamlined analysis of UMH.
How It Works
- Step 1: Download the Excel file.
- Step 2: Review pre-entered UMH data (historical and projected).
- Step 3: Adjust key assumptions (yellow cells) based on your analysis.
- Step 4: View automatic recalculations for UMH’s intrinsic value.
- Step 5: Use the outputs for investment decisions or reporting.
Why Choose UMH Properties, Inc. (UMH)?
- Streamlined Process: Quickly access comprehensive property data without the hassle of extensive research.
- Enhanced Accuracy: Utilize trusted market insights to ensure precise investment evaluations.
- Fully Adaptable: Customize your investment strategies to align with your financial goals.
- User-Friendly Interface: Intuitive design allows for straightforward navigation and analysis.
- Endorsed by Industry Leaders: Developed for investors who prioritize reliability and ease of use.
Who Should Use UMH Properties, Inc. (UMH)?
- Real Estate Students: Understand property valuation techniques and apply them with current market data.
- Academics: Integrate industry-standard models into educational programs or research initiatives.
- Investors: Evaluate your investment strategies and assess valuation metrics for UMH Properties, Inc. (UMH).
- Analysts: Enhance your analysis process with a ready-to-use, customizable DCF model tailored for real estate.
- Real Estate Developers: Discover how large-scale public companies like UMH Properties, Inc. (UMH) are evaluated in the market.
What the Template Contains
- Comprehensive DCF Model: Editable template featuring detailed valuation calculations tailored for UMH Properties, Inc. (UMH).
- Real-World Data: Historical and projected financials of UMH Properties, Inc. (UMH) preloaded for in-depth analysis.
- Customizable Parameters: Adjust WACC, growth rates, and tax assumptions to explore various scenarios for UMH Properties, Inc. (UMH).
- Financial Statements: Complete annual and quarterly breakdowns providing deeper insights into UMH Properties, Inc. (UMH).
- Key Ratios: Integrated analysis covering profitability, efficiency, and leverage for UMH Properties, Inc. (UMH).
- Dashboard with Visual Outputs: Charts and tables designed for clear, actionable results specific to UMH Properties, Inc. (UMH).
Disclaimer
All information, articles, and product details provided on this website are for general informational and educational purposes only. We do not claim any ownership over, nor do we intend to infringe upon, any trademarks, copyrights, logos, brand names, or other intellectual property mentioned or depicted on this site. Such intellectual property remains the property of its respective owners, and any references here are made solely for identification or informational purposes, without implying any affiliation, endorsement, or partnership.
We make no representations or warranties, express or implied, regarding the accuracy, completeness, or suitability of any content or products presented. Nothing on this website should be construed as legal, tax, investment, financial, medical, or other professional advice. In addition, no part of this site—including articles or product references—constitutes a solicitation, recommendation, endorsement, advertisement, or offer to buy or sell any securities, franchises, or other financial instruments, particularly in jurisdictions where such activity would be unlawful.
All content is of a general nature and may not address the specific circumstances of any individual or entity. It is not a substitute for professional advice or services. Any actions you take based on the information provided here are strictly at your own risk. You accept full responsibility for any decisions or outcomes arising from your use of this website and agree to release us from any liability in connection with your use of, or reliance upon, the content or products found herein.