
|
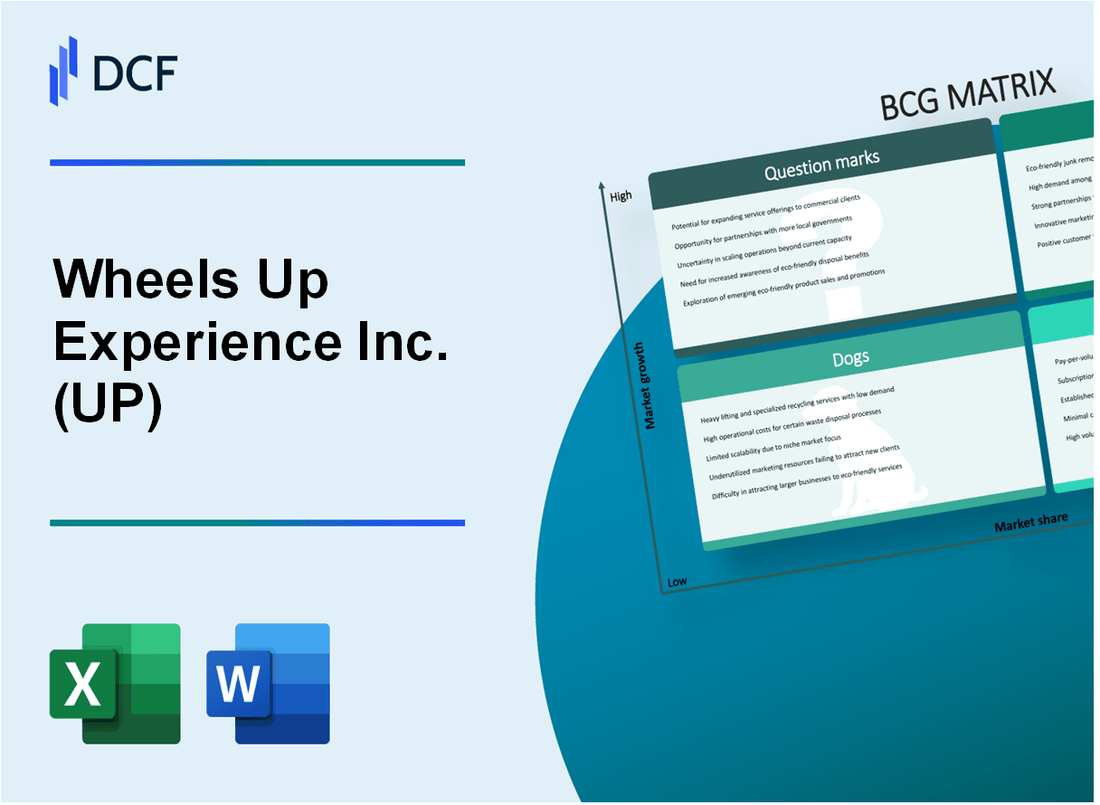
Wheels Up Experience Inc. (UP): BCG Matrix [Dec-2025 Updated] |
Fully Editable: Tailor To Your Needs In Excel Or Sheets
Professional Design: Trusted, Industry-Standard Templates
Investor-Approved Valuation Models
MAC/PC Compatible, Fully Unlocked
No Expertise Is Needed; Easy To Follow
Wheels Up Experience Inc. (UP) Bundle
You're looking for a clear-eyed view of Wheels Up Experience Inc. (UP) right now, and the BCG Matrix is defintely the right tool to map their strategic transformation in 2025. We've mapped their portfolio, finding high-growth Stars like $62$ million in Corporate Membership Fund sales and stable Cash Cows underpinned by $711.2$ million in deferred revenue. Still, the company is actively shedding Dogs, like the programs causing a 4% revenue dip, while betting big on Question Marks like the new Signature Membership and a costly fleet modernization that contributed to an $83.7$ million net loss last quarter. Dive in to see exactly where you should focus your attention on this evolving private aviation player.
Background of Wheels Up Experience Inc. (UP)
You're looking at Wheels Up Experience Inc. (UP) as of late 2025, and the story isn't just about top-line growth anymore; it's about a deliberate pivot toward financial discipline. This shift is underscored by the August 20, 2025, completion of the sale of its Non-Core Services Businesses, like Baines Simmons Limited, to focus squarely on its core private aviation services. Honestly, this move signals a clear intent to streamline operations and concentrate resources where they matter most for the bottom line.
When you check the recent revenue figures, you see the impact of this strategic realignment. For the first quarter of 2025, Wheels Up Experience Inc. posted revenue of $177.5 million, which was a 10% decrease year-over-year. That trend continued into the second quarter with revenue at $189.6 million, down 3% from the prior year, and then further in the third quarter to $185.5 million, a 4% drop compared to Q3 2024. Still, analysts are forecasting full-year 2025 sales to land around $2.17 billion, suggesting that while quarterly revenue has been choppy, the overall annual target remains ambitious.
The real positive news you should focus on is the improved profitability metrics, which is what management is emphasizing. In Q2 2025, the net loss was reduced by 15% to $82.3 million, and the Adjusted Contribution Margin hit 12.2%. This operational improvement is tied to their fleet modernization; premium Phenom and Challenger jets made up about 30% of the controlled fleet by the end of Q3, with a goal of reaching 50% by the end of 2025. Plus, the partnership with Delta Air Lines is driving commercial momentum, evidenced by corporate membership fund sales increasing over 25% year-over-year in Q2. To support this, Wheels Up Experience Inc. is implementing initiatives expected to drive $70 million or more in annual cash cost savings.
Wheels Up Experience Inc. (UP) - BCG Matrix: Stars
The Stars quadrant represents business units or offerings within Wheels Up Experience Inc. (UP) that command a high market share within a rapidly expanding market. These are the current leaders that require significant investment to maintain their growth trajectory and market position, which is why their cash flow is often near break-even, despite high revenue generation.
Corporate Membership Fund sales, heavily bolstered by the Delta Air Lines partnership, represent a key Star component, hitting a record $62 million in the third quarter of 2025. This figure marks an increase of more than 15% year over year. Furthermore, this corporate segment's strength is evident as it represented 49% of total Membership Fund sales for the quarter, an increase of 12 points over the prior year period.
The high-growth nature of the on-demand segment is also indicative of a Star. On-demand charter offerings drove a strong 14% year-over-year growth in Total Gross Bookings for the third quarter of 2025. This growth contributed to Total Gross Bookings reaching $266.6 million, which was up 5% year over year, even as overall revenue was down 4% to $185.5 million due to the exit of discontinued programs.
Investment is clearly being channeled into the premium fleet, which is central to securing future market share. The premium Phenom and Challenger jet fleet comprised approximately 30% of the controlled jet fleet at the end of the third quarter of 2025, and management expects this to expand to nearly 50% of the controlled fleet by year-end 2025. This strategic shift is designed to capture the high-value customer base through the new Signature Membership.
The operational execution supporting this growth is critical. Improved operational reliability provides a tangible competitive advantage in this high-growth market. Wheels Up Experience Inc. delivered a 99% Completion Rate in Q3 2025, which was up 1 point year over year. The company also achieved 24 brand days in the quarter, defined as days with a perfect completion rate and no cancellations. On-Time Performance (D-60) was 89%, an improvement of 4 points from the prior period.
Here's a look at the utilization metrics for these key Star aircraft types in Q3 2025:
| Aircraft Type | Utility (Hours) - Q3 2025 |
| Embraer Phenom 300 series | 56 |
| Bombardier Challenger 300 series | 53 |
| Legacy Fleet Aircraft | 40 |
The focus on these premium assets is clear, as the company expects the transition to be largely complete by year-end 2026, with at least 80% of the controlled jet fleet consisting of Phenom and Challenger aircraft by that time.
The investment required to sustain these leaders is reflected in the financial performance, where operational improvements are still being pressured by transition costs. Key operational and commercial metrics for the Star segments in Q3 2025 include:
- Corporate Membership Fund Sales: $62 million (record quarterly high).
- On-demand Charter Growth: 14% YoY growth in Total Gross Bookings contribution.
- Completion Rate: 99%.
- Phenom/Challenger Fleet Share: Expected to reach nearly 50% by year-end 2025.
Wheels Up Experience Inc. (UP) - BCG Matrix: Cash Cows
Deferred revenue, representing prepaid flight balances, stood at $711.2 million as of September 30, 2025, providing a massive, stable cash float that supports operations before services are rendered.
The core, established base of individual and corporate members continues to drive activity. Corporate Membership Fund sales reached a quarterly high of $62 million in the third quarter of 2025, marking an increase of more than 15% year-over-year. This segment represented 49% of Membership Fund sales for the quarter.
The overall brand equity and market position as one of North America's largest private jet providers stabilizes demand. Total Gross Bookings for the third quarter of 2025 were $266.6 million, reflecting a 5% increase year-over-year. On-demand charter offerings specifically grew by 14% year-over-year in the third quarter.
Strategic cost-saving initiatives are now expected to drive approximately $70 million or more in annual run-rate cash savings through efficiency, productivity, and overhead cost reductions. These actions are expected to be completed by the first quarter of 2026, with the full run-rate impact anticipated by the third quarter of 2026.
The financial performance supporting the Cash Cow status can be viewed through these key metrics:
| Metric | Value as of September 30, 2025 (Q3) | Comparison/Context |
| Deferred Revenue | $711.2 million | Prepaid flight balances providing cash float. |
| Total Gross Bookings | $266.6 million | Up 5% year-over-year. |
| Corporate Membership Fund Sales | $62 million | Record quarterly high, up more than 15% YoY. |
| Adjusted Contribution Margin | 12.7% | Compared to 14.8% in the prior year period. |
| Cash and Cash Equivalents | $125.3 million | Part of total liquidity. |
| Targeted Annual Cost Savings Run-Rate | $70 million+ | Increase from the original $50 million estimate. |
The stability is further evidenced by operational metrics that support consistent service delivery:
- Completion Rate: 99%, up 1 point year-over-year.
- On-Time Performance (D-60): 89%, up 4 points from the prior period.
- Brand Days with no cancellations: 24 in the quarter.
The company is focusing investment to maintain this position, with premium jets comprising approximately 30% of the controlled jet fleet at quarter end, expected to be approximately 50% by year-end 2025.
Wheels Up Experience Inc. (UP) - BCG Matrix: Dogs
You're looking at the parts of Wheels Up Experience Inc. (UP) that are consuming focus without delivering proportional returns, the classic Dogs in the portfolio. These are the low-growth, low-market-share elements that management is actively trying to prune or retire, so the core business can focus on Stars and Cash Cows.
The strategic exit from certain legacy programs is a clear indicator of this quadrant's influence. The discontinued Connect and Pay-As-You-Fly membership programs were a drag. This move, intended to stop unprofitable flying, directly caused a 4% year-over-year revenue decline in the third quarter of 2025, with reported Q3 2025 revenue landing at $185.5 million.
The financial impact on legacy membership revenue was stark. Due to the strategic program changes, flight revenue from these legacy memberships fell sharply year-over-year by -52% in Q3 2025. This sharp drop in revenue from these specific legacy contracts highlights their low-growth, low-share status within the current strategic direction.
To streamline focus, Wheels Up Experience Inc. divested Non-Core Services Businesses. In August 2025, the company sold Baines Simmons Limited, along with two other entities, for approximately $20 million in gross proceeds before transaction-related expenses. One filing noted the sale generated about $21.5 million in net proceeds before transaction costs. This divestiture is a textbook move to minimize resource allocation to non-essential, low-growth areas.
The fleet composition itself contains legacy assets that fit the Dog profile. These older aircraft have lower utilization and higher operating costs, directly pressuring margins during the transition phase. The gross loss for Q3 2025 was $1.3 million, which included $8.7 million of non-recurring fleet modernization expense, covering costs like incremental aircraft rent and maintenance incurred while exiting these older assets.
Here's a quick look at the fleet composition as this transition is underway:
| Fleet Category | Percentage of Fleet (Q3 2025 End) | Associated Action/Impact |
| Premium Phenom and Challenger jets | Approximately 30% (expected 50% by year-end 2025) | Focus of modernization investment |
| Legacy jets | 34% | Being retired; contributed to $8.7 million non-recurring expense in Q3 2025 |
| Turboprops | 22% | Intends to continue operating King Airs |
The effort to move away from these legacy assets is substantial, as the overall fleet transition is expected to be largely complete by the end of 2026, with at least 80% of the controlled jet fleet being Phenom and Challenger aircraft by that time.
The elements categorized as Dogs represent specific, identifiable actions taken to reduce cash traps and low-return activities:
- The discontinued Connect and Pay-As-You-Fly membership programs.
- The sale of Baines Simmons Limited and related non-core businesses in August 2025.
- Legacy aircraft like the Citation CJ3 and other older models being retired.
- The sharp -52% year-over-year decline in flight revenue from legacy membership programs in Q3 2025.
The company is actively working to shrink this quadrant, which is defintely the right move for near-term cash flow improvement. The cost of exiting these older assets is visible in the $8.7 million non-recurring modernization charge in Q3 2025.
The financial impact of these legacy/discontinued items can be summarized:
| Metric | Value/Amount | Period/Context |
| Revenue Decline YoY | 4% | Q3 2025 |
| Legacy Membership Revenue Decline YoY | -52% | Q3 2025 |
| Net Proceeds from Non-Core Sales (including Baines Simmons) | $21.5 million | August 2025 |
| Non-Recurring Fleet Modernization Expense | $8.7 million | Q3 2025 |
| Legacy Jets in Fleet | 34% | End of Q3 2025 |
Finance: draft 13-week cash view by Friday.
Wheels Up Experience Inc. (UP) - BCG Matrix: Question Marks
You're looking at the new, high-potential ventures within Wheels Up Experience Inc. that are burning cash now but could become future Stars. These are the areas where the market is growing, but the company's current slice of that market is still small, demanding heavy capital infusion to gain share quickly.
The core of the Question Marks category for Wheels Up Experience Inc. centers on its aggressive strategic pivot, which requires significant upfront spending before the returns materialize. The company is betting heavily on premiumization and fleet renewal to capture higher-value customers, but this transition is inherently costly and uncertain in the near term.
The newly launched Signature Membership program, which started on September 3rd, is a prime example of this dynamic. In its first two months (September and October 2025), this program captured nearly 20% of total block sales. To be fair, about two-thirds of those sales came from existing customers converting to this new type, showing initial product appeal. Still, proving the long-term profitability of this new structure requires sustained investment in the underlying premium fleet and sales efforts.
The fleet modernization process itself is a massive Question Mark. This high-cost, high-risk investment is reshaping the operational backbone of Wheels Up Experience Inc. The financial impact of this transition was clearly visible in the third quarter of 2025, which included $8.7 million of non-recurring modernization costs. These costs pressured margins, contributing to a gross loss of $1.3 million for the quarter, compared to a gross profit of $14.5 million in the comparable period last year. The fleet composition at the end of Q3 2025 showed premium jets (Phenom 300s and Challenger 300s) making up 30% of the controlled fleet, with the goal to reach 80% by the end of 2026.
The financial strain of this investment phase is clear when you look at the balance sheet pressures. The high interest expense is a direct consequence of financing this transformation. Interest expense rose to $23.5 million in Q3 2025, up from $16.0 million in the prior year period. This higher financing burden directly contributed to widening the net loss to $83.7 million for the quarter, compared to a net loss of $57.7 million in Q3 2024. The company's total revenue for Q3 2025 was $185.5 million.
The high-stakes target for the near future is achieving positive Adjusted EBITDAR in 2026. Management has reiterated this expectation, viewing the fourth quarter of 2025 as the best since the transformation began, setting the stage for acceleration into 2026. This target is set against a backdrop of a challenging private aviation market and the need to fully scale the new strategy to offset current cash consumption.
Here's a quick look at the key financial metrics associated with this high-cash-burn phase:
| Metric | Value (Q3 2025) | Context |
| Net Loss | $83.7 million | Widened from $57.7 million YoY |
| Interest Expense | $23.5 million | Increased from $16.0 million YoY |
| Non-Recurring Modernization Costs | $8.7 million | Impacted Q3 Gross Loss |
| Targeted Annual Cost Savings Run-Rate | $70 million or more | Full run-rate expected by Q3 2026 |
| Liquidity at Quarter-End | ~$225 million | ($125M cash plus $100M undrawn revolver) |
The strategy here is clear: invest heavily now to rapidly gain market share with the new premium product-the Signature Membership-and realize the cost efficiencies from the fleet simplification. If the growth in premium segments does not quickly translate into improved profitability and cash flow, these Question Marks risk becoming Dogs.
- Signature Membership captured ~20% of block sales in Sep/Oct 2025.
- Non-recurring modernization costs totaled $8.7 million in Q3 2025.
- The goal is positive Adjusted EBITDAR for the full year 2026.
- Q3 2025 interest expense was $23.5 million.
- Q3 2025 net loss was $83.7 million.
The company is using capital to force this transition, having raised approximately $50 million via an ATM offering in Q3 2025 to fund fleet modernization. Finance: draft 13-week cash view by Friday.
Disclaimer
All information, articles, and product details provided on this website are for general informational and educational purposes only. We do not claim any ownership over, nor do we intend to infringe upon, any trademarks, copyrights, logos, brand names, or other intellectual property mentioned or depicted on this site. Such intellectual property remains the property of its respective owners, and any references here are made solely for identification or informational purposes, without implying any affiliation, endorsement, or partnership.
We make no representations or warranties, express or implied, regarding the accuracy, completeness, or suitability of any content or products presented. Nothing on this website should be construed as legal, tax, investment, financial, medical, or other professional advice. In addition, no part of this site—including articles or product references—constitutes a solicitation, recommendation, endorsement, advertisement, or offer to buy or sell any securities, franchises, or other financial instruments, particularly in jurisdictions where such activity would be unlawful.
All content is of a general nature and may not address the specific circumstances of any individual or entity. It is not a substitute for professional advice or services. Any actions you take based on the information provided here are strictly at your own risk. You accept full responsibility for any decisions or outcomes arising from your use of this website and agree to release us from any liability in connection with your use of, or reliance upon, the content or products found herein.