
|
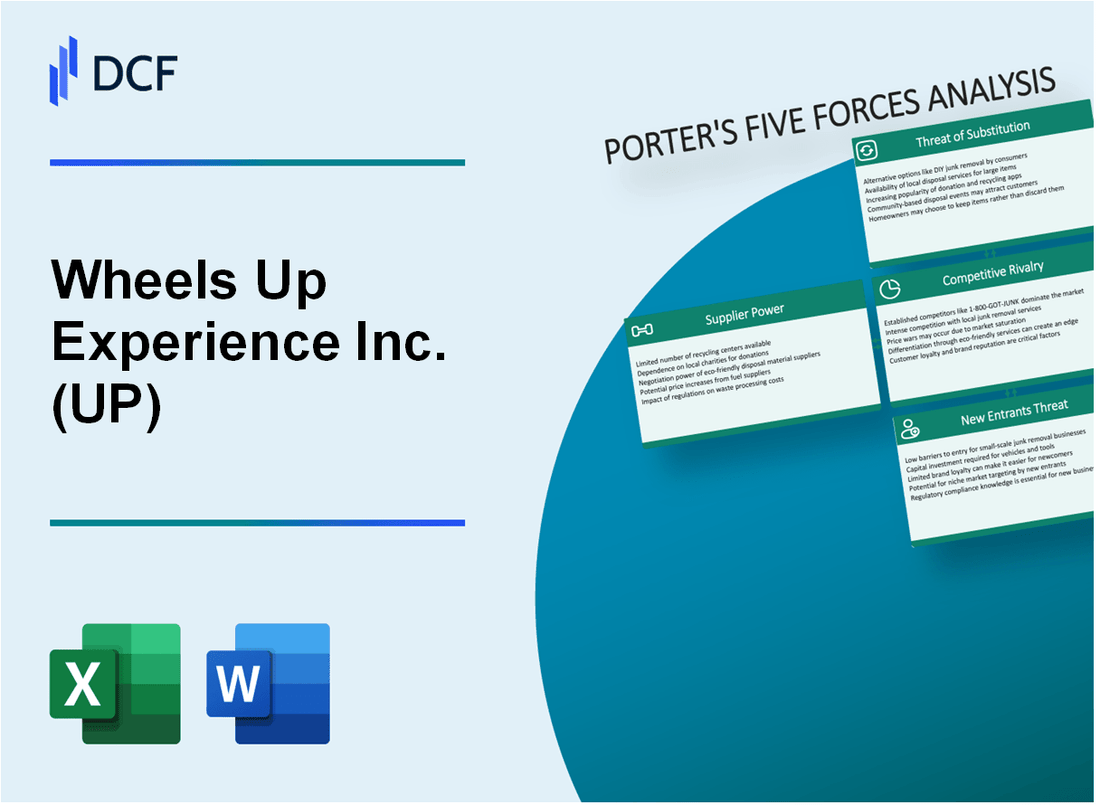
Wheels Up Experience Inc. (UP): 5 FORCES Analysis [Nov-2025 Updated] |
Fully Editable: Tailor To Your Needs In Excel Or Sheets
Professional Design: Trusted, Industry-Standard Templates
Investor-Approved Valuation Models
MAC/PC Compatible, Fully Unlocked
No Expertise Is Needed; Easy To Follow
Wheels Up Experience Inc. (UP) Bundle
You're looking for a clear-eyed view of Wheels Up Experience Inc. (UP)'s competitive position, so let's map out the five forces influencing their market strategy right now. Honestly, the landscape is tough: while Total Gross Bookings rose to $266.6 million in Q3 2025, that still came with a $83.7 million net loss, showing just how fierce the rivalry is against players like NetJets. You've got suppliers-from pilots in a tight labor market to fuel providers-holding real sway, and your high-net-worth customers are definitely price-sensitive, even with membership lock-in. To truly understand where the pressure is coming from and how the Delta Air Lines partnership is helping to offset threats from substitutes and new entrants, you need to see the full breakdown below.
Wheels Up Experience Inc. (UP) - Porter's Five Forces: Bargaining power of suppliers
You're looking at the supplier side of the equation for Wheels Up Experience Inc. (UP), and honestly, it's a mixed bag where certain external parties hold significant sway over operational costs and service delivery. The core of the bargaining power here stems from the necessity of their inputs-be it the planes, the pilots to fly them, or the fuel to power the journey.
Dependence on third-party operators for its asset-light model increases leverage for those charter providers. While the asset-light approach offers flexibility, it means Wheels Up Experience Inc. must rely on a global network of safety-vetted charter operators to meet demand beyond its controlled fleet. Any performance issues or rate increases from these partners directly impact service consistency and operational risk. This reliance is a key structural feature of the business model.
Fuel costs are a major operational expense, giving significant power to global fuel suppliers. Aviation fuel is a commodity, and price volatility directly pressures the bottom line. For the three months ended September 30, 2025, Wheels Up Experience Inc. reported a total revenue of $185.49 million and a loss from operations of $61.34 million. While the exact fuel cost percentage for 2025 isn't public, historical data suggests significant sensitivity; for instance, a hypothetical 10% increase in fuel price in 2022 would have meant an approximate $22 million increase in expense for that year.
A tight labor market for qualified pilots drives up wages and operational costs. Attracting and retaining qualified personnel, especially pilots, is crucial for matching the workforce to market demand. The supply of pilots is limited, which inherently pushes up labor costs, a substantial portion of total operating costs. To manage this, Wheels Up Experience Inc. implemented layoffs of around 11% of its pilots in mid-2024, partly due to lower attrition rates at the time. Still, the underlying pressure from pilot compensation remains a supplier power point.
Fleet modernization relies on a few key manufacturers like Embraer and Bombardier for new aircraft. Wheels Up Experience Inc. is actively transitioning to premium aircraft, specifically the Embraer Phenom 300 series and Bombardier Challenger 300 series. As of the end of the third quarter of 2025, these modern jets made up about 30% of the controlled fleet, with a goal to reach 50% by the end of 2025. Embraer, a primary supplier in this segment, is projecting deliveries of between 145 to 155 executive jets for 2025. The reliance on these specific manufacturers for fleet renewal gives them leverage over pricing and delivery schedules.
The strategic partnership with Delta Air Lines, Inc. acts as both a supplier and a financial backstop. Delta Air Lines, which owns a 95% share in Wheels Up Experience Inc., provides access to its commercial network and benefits for members, such as Delta SkyMiles status. This relationship is deeply integrated, with lead investors, including Delta, representing approximately 85% of the total outstanding shares as of September 22, 2025. While Delta's influence is more structural than a typical supplier relationship, its control over capital and commercial channels definitely shapes the operating environment for Wheels Up Experience Inc.
Here's a quick look at the supplier landscape metrics we can quantify:
| Supplier Category | Key Metric/Data Point | Value/Context |
|---|---|---|
| Third-Party Operators | Model Reliance | Asset-light charter model dependence |
| Fuel Suppliers | Q3 2025 Revenue | $185.49 million |
| Fuel Suppliers | Historical Cost Sensitivity Example | 10% price increase = approx. $22 million expense change (2022 data) |
| Pilot Labor Market | Pilot Layoff Percentage (Mid-2024) | Around 11% of pilots laid off |
| Aircraft Manufacturers (Embraer/Bombardier) | Premium Fleet Percentage (Q3 2025 End) | Approximately 30% of controlled fleet |
| Aircraft Manufacturers (Embraer) | Projected 2025 Executive Jet Deliveries | Between 145 to 155 aircraft |
| Strategic Partner (Delta/Investors) | Delta Air Lines Ownership Stake | 95% share |
| Strategic Partner (Delta/Investors) | Lead Investor Share of Equity (Sept 2025) | Approximately 85% of total outstanding shares |
The power of these suppliers is amplified by Wheels Up Experience Inc.'s ongoing need to improve profitability. For example, the company announced initiatives estimated to drive approximately $50 million of annualized cost efficiencies. Successfully navigating supplier power requires managing these costs effectively, especially as the fleet modernization continues.
You should review the current contract terms with the major third-party charter networks to see if fixed-rate commitments are locking in unfavorable pricing relative to spot market rates. Finance: draft 13-week cash view by Friday.
Wheels Up Experience Inc. (UP) - Porter's Five Forces: Bargaining power of customers
The bargaining power of customers for Wheels Up Experience Inc. is a dynamic factor, heavily influenced by the company's strategic shift toward a more committed, core membership base. While the pre-paid nature of the primary offering creates friction for customers looking to leave, the high-net-worth segment remains acutely aware of competitive pricing.
Power is moderated by membership models requiring pre-paid flight funds, creating switching costs. The new Wheels Up Signature Membership, launched in September 2025, anchors customers with a minimum pre-paid deposit of $200,000 and a $500 monthly membership fee. These funds are largely non-refundable, which acts as a significant switching cost. Furthermore, the agreement structure dictates renewal terms based on the remaining balance; if funds dip below 10% of the original deposit, the member must add a minimum of $50,000 or fund the difference to the original deposit amount to continue, locking in capital. This structure is designed to secure customer commitment and provide Wheels Up Experience Inc. with interest-free financing for fleet modernization.
The financial results from late 2025 clearly show the impact of shedding less committed customers. The Q3 2025 revenue of $185.5 million was down 4% year-over-year. This top-line pressure is directly linked to the strategic exit of lower-tier programs, as Membership Revenue specifically dropped 52% year-over-year in Q3, landing at $6.3 million. This indicates that while the overall customer base shrank in the short term, the remaining base is more valuable, which is the intended trade-off.
High-net-worth customers are price-sensitive and can easily compare programs from rivals like NetJets and Flexjet. Market analysis from late 2025 suggests that Wheels Up Experience Inc. is positioned as attractive to 'cost-conscious frequent flyers' due to its 'pricing transparency and lower barriers to entry' relative to premium providers. For instance, an estimated 25-hour jet card hourly rate for Wheels Up Experience Inc. was placed at $9,140, compared to $11,156 for NetJets and $10,730 for Flexjet. This price differential gives sophisticated buyers leverage to negotiate or switch if service quality falters.
Wheels Up Experience Inc. is focusing on core members after discontinuing Connect and Pay-As-You-Fly, increasing the value of the remaining customer base. The company is clearly prioritizing high-value segments, evidenced by the record corporate momentum. Corporate Membership Fund sales reached $62 million in Q3 2025, marking an increase of more than 15% year-over-year, and this segment accounted for 49% of total Membership Fund sales for the quarter.
Despite the revenue contraction from program exits, demand for high-value, on-demand services remains robust. Total Gross Bookings rose 5% to $266.6 million in Q3 2025, showing strong demand for on-demand charter offerings, which grew 14% year-over-year. This bifurcation in performance-revenue down, but gross bookings up-shows that customers are willing to pay for immediate, flexible lift, but are less willing to commit to the older, less flexible membership structures.
Here is a summary of the key Q3 2025 financial performance metrics:
| Metric | Value (Q3 2025) | Year-over-Year Change |
|---|---|---|
| Revenue | $185.5 million | Down 4% |
| Total Gross Bookings | $266.6 million | Up 5% |
| Membership Revenue | $6.3 million | Down 52% |
| On-Demand Charter Growth (Bookings) | N/A | Up 14% |
| Corporate Membership Fund Sales | $62 million | Up 15%+ |
The customer power dynamic is being managed through product design:
- Minimum Signature Membership deposit is $200,000.
- Fixed Plan hourly rates start at $9,295 (Phenom 300) at the minimum tier.
- The new structure offers guaranteed access 365 days a year.
- Funds can be applied toward Delta Air Lines travel.
- The agreement term is up to five years, renewing on anniversary or fund depletion.
Wheels Up Experience Inc. (UP) - Porter's Five Forces: Competitive rivalry
You're analyzing the competitive landscape for Wheels Up Experience Inc. (UP) as of late 2025, and rivalry is definitely the most immediate pressure point you need to watch. The market for private aviation access is crowded, meaning that every percentage point of market share is hard-won.
Rivalry is intense, featuring fractional ownership leaders like NetJets, which holds approximately 12% of all global private jet trips, and Flexjet. Wheels Up Experience Inc. reported a Q3 2025 net loss of $83.7 million, showing high competitive cost pressures on profitability, especially while managing a major fleet transition. Honestly, that widening loss, up from $57.73 million the prior year, speaks volumes about the pricing environment.
The private aviation market is highly competitive, with numerous players vying for the same affluent customer segment. To give you a clearer picture of where Wheels Up Experience Inc. stands against a top-tier rival in the fractional space, look at these Q3 2025 operational and financial snapshots:
| Metric | Wheels Up Experience Inc. (Q3 2025) | NetJets (Comparative Data Point) |
|---|---|---|
| Net Loss (USD) | $83.73 million | Not Publicly Disclosed (Private Company) |
| Total Gross Bookings (USD) | $266.6 million | Not Publicly Disclosed |
| On-Demand Charter Growth (YoY) | 14% | Flexjet saw a 17% gain in Q1 2025 segments |
| Completion Rate | 99% | Not Publicly Disclosed |
| Fleet Modernization Expense (Non-Recurring) | $8.7 million | Not Applicable/Disclosed |
Differentiation is crucial, with competitors focusing heavily on service quality, fleet age, and technology. Wheels Up Experience Inc. is actively pushing its fleet modernization, aiming for approximately 50% of its controlled jet fleet to be Premium Phenom and Challenger jets by year-end 2025, up from 30% at quarter-end. Still, the pressure to maintain service while upgrading is evident in the reported gross loss of $1.3 million for the quarter, which was pressured by $8.7 million in non-recurring fleet modernization expenses.
Here are some of the key operational metrics that define the competitive battleground for Wheels Up Experience Inc. right now:
- On-Time Performance (D-60) reached 89% in Q3 2025.
- Completion Rate stood at 99% for the third quarter.
- Projected annual cash cost savings target is $70 million or more.
- The company achieved 24 brand days in Q3 2025.
The partnership with Delta Air Lines provides a unique competitive edge through integrated travel solutions. This integration is showing up in the numbers; for instance, corporate Membership Fund sales via the Delta cross-sell initiative hit a quarterly high of $62 million in Q3 2025, representing an increase of more than 15% year-over-year. Finance: draft 13-week cash view by Friday.
Wheels Up Experience Inc. (UP) - Porter's Five Forces: Threat of substitutes
You're looking at the substitutes for Wheels Up Experience Inc.'s core offering-the private travel experience. The threat here isn't just one thing; it's a spectrum of options that can pull a customer away, especially when they weigh the premium price tag against their budget or need for that specific trip.
Premium commercial air travel, especially business class, is definitely a viable, lower-cost substitute for many long-haul routes. While Wheels Up Experience Inc. focuses on privacy and schedule control, commercial first class offers significant luxury for a fraction of the cost, particularly for solo flyers. For instance, a first-class ticket might run between $5,000 and $15,000 for a long-haul journey, or even as low as $1,000 to $5,000 on some international routes. Compare that to a private charter, which can range from $10,000 for short flights up to $100,000 for transatlantic routes. The hourly rate for a private jet charter generally falls between $2,000 and $18,000 per flight hour, with premium aircraft sometimes exceeding $30,000 per hour.
Here's a quick math look at where the economics shift:
| Route Type | First Class Cost (Per Person) | Private Jet Cost (Total Estimate) | Break-Even Passenger Count |
|---|---|---|---|
| 3-Hour Domestic | $1,200 | $10,000 | 12 |
| 6-Hour Transcontinental | $2,400 | $22,000 | 11 |
| 10-Hour International | $5,000 | $45,000 | 9 |
This table shows that for a group of 9 to 12 passengers, the per-person cost starts to narrow significantly, making the privacy and time savings of a private jet more compelling against the fixed cost of commercial first class. Still, for the individual flyer, the commercial option remains substantially cheaper.
Charter brokers and online marketplaces present a direct challenge by offering on-demand private flights without the commitment of a Wheels Up Experience Inc. membership fee. The broader private jet charter services market reached $16.38 billion in 2025. While Wheels Up Experience Inc. saw its on-demand charter offerings grow 14% year-over-year in Q3 2025, this growth is happening within a market where on-demand charter already held 52.18% of the revenue share in 2024. Furthermore, subscription-based solutions in the charter space are forecasted to advance at a 9.85% CAGR through 2030, showing that flexible, non-membership commitment models are gaining ground. It's worth noting that flexible options like jet cards and on-demand charters now account for about 25% of private jet users overall.
Alternative transportation for short-haul, non-hub routes, such as high-speed rail or luxury ground transport, is a minor threat. These options compete on specific city pairs where ground infrastructure is excellent, but they lack the speed and reach of even light private jets. Wheels Up Experience Inc. is focused on premium air travel, and these ground/rail options do not substitute the core value proposition for most of its target clientele.
Economic uncertainty could definitely push customers to cheaper travel options, including flying first class on commercial airlines. We saw this pressure in Wheels Up Experience Inc.'s Q3 2025 results, where revenue was $185.5 million, marking a 4% decline year-over-year, partly due to discontinuing lower-tier members. However, the stickiness of the core customer base is evident in the corporate Membership Fund sales, which hit a quarterly high of $62 million in Q3 2025, up more than 15% year-over-year, and now represent 49% of total Membership Fund sales. The new Signature Membership, launched in September 2025, requires a minimum $200,000 pre-paid deposit, suggesting that the highest-value customers are still committing significant capital for guaranteed access. The company is actively working to mitigate cost pressures by targeting over $70 million in annual run-rate cost savings by Q3 2026.
Wheels Up Experience Inc. (UP) - Porter's Five Forces: Threat of new entrants
You're assessing the barriers for a new competitor trying to break into the private aviation space where Wheels Up Experience Inc. operates. The threat of new entrants is generally considered moderate to low, primarily due to the massive upfront investment and regulatory moat the company has built, though technology-focused entrants present a slight counter-pressure.
High capital requirements for purchasing or leasing a proprietary fleet of aircraft create a significant barrier to entry. A new operator looking to build a comparable owned/leased fleet to Wheels Up Experience Inc.'s, which stood at over 120 aircraft as of June 2025, faces staggering initial costs. New private jets in 2025 can command purchase prices ranging from $5 million to $30 million, with entry-level options still starting around $2 million. Furthermore, annual operating expenses for even a single jet can run from $250,000 to over a million dollars yearly, covering fixed costs like crew, maintenance, and hangar space, regardless of flight volume.
Regulatory hurdles and the need for FAA/DOT certifications are complex and time-consuming. Establishing an air carrier certificate, which is necessary for operating a proprietary fleet, requires navigating rigorous processes. Applicants must secure Department of Transportation (DOT) economic authority before the FAA will even begin Proving Tests for operations specifications. While the FAA announced procedural updates in June 2025 intended to streamline the process and reduce wait times for prepared applicants, the fundamental complexity and oversight required for 14 CFR Part 135 or 121 operations remain a substantial hurdle that new entrants must clear.
The company's asset-light charter model, which relies on a network of operators, slightly lowers the barrier for purely tech-driven brokerage models. New entrants can focus on developing a superior digital platform, similar to the one used by Wheels Up Experience Inc. to manage its network, rather than immediately acquiring physical assets. For instance, the on-demand charter segment, which includes flights arranged outside North America by Wheels Up Experience Inc.'s Air Partner brokering unit, saw a 14% growth in bookings in the third quarter of 2025. This suggests that a pure-play technology broker, focused on aggregating supply, faces a lower initial capital barrier than a traditional operator.
Establishing a globally recognized brand and a safety-vetted network like Wheels Up Experience Inc.'s takes years. The company connects its members to a network that was reported to include more than 1,500 safety-vetted and verified private aircraft as of May 2023, a scale that implies years of relationship building and rigorous operator vetting. This established trust and scale are critical in an industry where safety perception is paramount. The sheer size of the market they operate in, with the global private jet market projected to reach $39.84 billion in 2025, requires significant marketing spend and operational history to match the brand equity Wheels Up Experience Inc. has cultivated.
| Barrier Component | Metric/Data Point | Value (2025 or Latest Available) |
|---|---|---|
| Proprietary Fleet Barrier (Asset Cost) | New Jet Purchase Price Range | $5 million to $30 million |
| Proprietary Fleet Barrier (Operating Cost) | Annual Operating Expenses Range | $250,000 to over $1 million |
| Proprietary Fleet Barrier (Scale) | Wheels Up Controlled Fleet Size | Over 120 aircraft (as of June 2025) |
| Regulatory Barrier (Process Improvement) | FAA Certification Update Announcement | June 2025 |
| Asset-Light Barrier (Brokerage Growth) | Air Partner On-Demand Charter Growth (Q3 2025) | 14% |
| Brand/Network Barrier (Scale) | Reported Safety-Vetted Aircraft Network Size | 1,500 aircraft |
- Regulatory compliance requires securing DOT economic authority before FAA proving tests.
- The company's TTM revenue as of September 30, 2025, was $757M.
- Wheels Up flew 22,866 live flight legs in the first six months of 2025.
- New entrants face competition from a market projected at $39.84 billion in 2025.
Disclaimer
All information, articles, and product details provided on this website are for general informational and educational purposes only. We do not claim any ownership over, nor do we intend to infringe upon, any trademarks, copyrights, logos, brand names, or other intellectual property mentioned or depicted on this site. Such intellectual property remains the property of its respective owners, and any references here are made solely for identification or informational purposes, without implying any affiliation, endorsement, or partnership.
We make no representations or warranties, express or implied, regarding the accuracy, completeness, or suitability of any content or products presented. Nothing on this website should be construed as legal, tax, investment, financial, medical, or other professional advice. In addition, no part of this site—including articles or product references—constitutes a solicitation, recommendation, endorsement, advertisement, or offer to buy or sell any securities, franchises, or other financial instruments, particularly in jurisdictions where such activity would be unlawful.
All content is of a general nature and may not address the specific circumstances of any individual or entity. It is not a substitute for professional advice or services. Any actions you take based on the information provided here are strictly at your own risk. You accept full responsibility for any decisions or outcomes arising from your use of this website and agree to release us from any liability in connection with your use of, or reliance upon, the content or products found herein.