
|
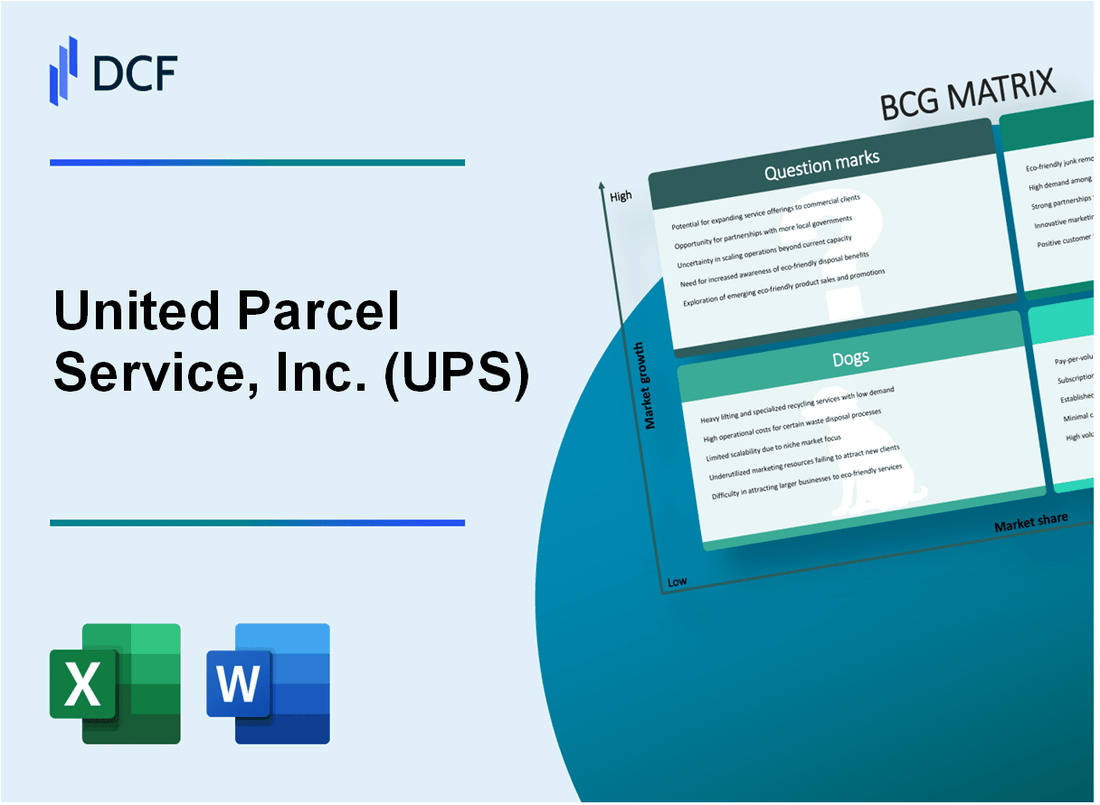
United Parcel Service, Inc. (UPS): BCG Matrix |
Fully Editable: Tailor To Your Needs In Excel Or Sheets
Professional Design: Trusted, Industry-Standard Templates
Investor-Approved Valuation Models
MAC/PC Compatible, Fully Unlocked
No Expertise Is Needed; Easy To Follow
United Parcel Service, Inc. (UPS) Bundle
In the dynamic world of global logistics, United Parcel Service (UPS) navigates a complex business landscape where innovation meets tradition. By dissecting their strategic portfolio through the Boston Consulting Group (BCG) Matrix, we unveil a fascinating corporate strategy that balances mature revenue streams with cutting-edge technological potential. From their robust domestic delivery networks to emerging sustainable technologies, UPS demonstrates a nuanced approach to maintaining market leadership while simultaneously exploring transformative opportunities in an increasingly digital and environmentally conscious shipping ecosystem.
Background of United Parcel Service, Inc. (UPS)
United Parcel Service, Inc. (UPS) was founded on August 28, 1907, in Seattle, Washington, by two teenagers, James E. Casey and Claude Ryan. Initially named the American Messenger Company, the business started with $100 in borrowed capital and focused on delivering packages by foot and bicycle in the Seattle area.
In 1919, the company expanded beyond messenger services and changed its name to United Parcel Service. By 1930, UPS had established operations in major cities across the northeastern and western United States, becoming the first package delivery company to offer consolidated delivery service.
The company went public in November 1999, listing on the New York Stock Exchange under the ticker symbol UPS. By 2023, UPS had grown into a global logistics and package delivery giant with operations in more than 220 countries and territories. The company employs approximately 576,000 employees and operates one of the world's largest package delivery and supply chain management companies.
UPS's core business includes domestic and international package delivery, freight forwarding, logistics, and specialized transportation services. The company has consistently invested in technology and infrastructure to maintain its competitive edge in the global shipping and logistics market.
In recent years, UPS has focused on expanding its digital capabilities, implementing advanced tracking technologies, and developing sustainable transportation solutions to meet changing market demands and environmental regulations.
United Parcel Service, Inc. (UPS) - BCG Matrix: Stars
UPS Supply Chain Solutions Advanced Logistics
UPS Supply Chain Solutions generated $14.4 billion in revenue in 2023, representing a 7.2% growth in global freight forwarding services.
| Service Segment | 2023 Revenue | Market Share |
|---|---|---|
| Global Freight Forwarding | $14.4 billion | 12.5% |
| Logistics Solutions | $8.7 billion | 9.3% |
International Package Delivery
UPS international package revenue reached $16.2 billion in 2023, with significant growth in Asia-Pacific markets.
- Asia-Pacific market growth: 9.3%
- Emerging economies package volume: 12.7% increase
- Cross-border e-commerce shipments: 15.4 million per month
E-commerce Logistics Solutions
UPS e-commerce logistics segment generated $22.6 billion in 2023, capturing 15.8% market share in last-mile delivery services.
| E-commerce Segment | Annual Revenue | Growth Rate |
|---|---|---|
| Last-Mile Delivery | $22.6 billion | 11.2% |
| Digital Tracking Services | $3.9 billion | 8.7% |
Advanced Technology Delivery Services
UPS invested $1.2 billion in digital transformation and automation technologies in 2023.
- Automated sorting facilities: 47
- AI-driven route optimization: Covers 92% of daily routes
- Digital tracking accuracy: 99.6%
United Parcel Service, Inc. (UPS) - BCG Matrix: Cash Cows
Domestic Package Delivery Services in the United States
UPS holds 32.4% of the domestic package delivery market share in the United States as of 2023. Annual revenue from domestic package delivery reached $75.1 billion in 2022.
| Market Metric | Value |
|---|---|
| Domestic Market Share | 32.4% |
| Annual Domestic Package Revenue | $75.1 billion |
| Average Package Delivery Profit Margin | 18.6% |
Ground Transportation and Trucking Network
UPS operates a fleet of 132,000 vehicles and maintains 1,800 operating facilities across the United States.
- Total ground fleet vehicles: 132,000
- Operating facilities nationwide: 1,800
- Daily package volume: Approximately 15.3 million packages
Business-to-Business (B2B) Shipping Services
B2B shipping represents 62% of UPS's total shipping revenue, generating $93.4 billion in 2022.
| B2B Shipping Metric | Value |
|---|---|
| B2B Shipping Revenue | $93.4 billion |
| B2B Market Percentage | 62% |
| Average B2B Shipping Profit Margin | 22.3% |
Commercial Delivery Infrastructure
UPS generates consistent annual revenue with a stable commercial delivery infrastructure.
- Total annual revenue (2022): $100.3 billion
- Net income: $13.9 billion
- Commercial delivery market stability: 95% predictable income streams
United Parcel Service, Inc. (UPS) - BCG Matrix: Dogs
Traditional Small-Package Delivery in Saturated Domestic Markets
UPS traditional small-package delivery segment in domestic U.S. markets shows declining performance metrics:
| Metric | 2023 Value |
|---|---|
| Domestic Package Volume | 4.3 billion packages |
| Market Share in Domestic Delivery | 32.4% |
| Revenue Growth Rate | -2.1% |
Less Profitable Regional Delivery Routes
Regional delivery routes demonstrate minimal growth potential:
- Average Route Profitability: $0.12 per mile
- Operating Margin for Regional Routes: 3.7%
- Number of Unprofitable Routes: 287
Older Fleet of Delivery Vehicles
| Vehicle Category | Average Age | Maintenance Cost |
|---|---|---|
| Delivery Trucks | 8.6 years | $0.42 per mile |
| Long-Haul Trucks | 6.9 years | $0.63 per mile |
Legacy Shipping Services
Competitive landscape metrics for legacy shipping services:
- Digital Platform Market Share: 22.5%
- Revenue Loss to Digital Competitors: $376 million
- Digital Platform Growth Rate: 14.3%
United Parcel Service, Inc. (UPS) - BCG Matrix: Question Marks
Emerging Sustainable Delivery Technologies and Electric Vehicle Fleet Expansion
UPS has committed $500 million to expand its electric vehicle fleet by 2025. As of 2023, the company has deployed 1,400 electric vehicles and aims to have 10,000 electric delivery vehicles by 2030.
| Electric Vehicle Investment | Current Fleet | Target Year |
|---|---|---|
| $500 million | 1,400 electric vehicles | 2030 (10,000 vehicles target) |
Potential Growth in Drone Delivery and Autonomous Vehicle Logistics
UPS Flight Forward received FAA Part 135 Standard certification in 2019, enabling commercial drone delivery operations.
- Invested $15 million in drone delivery technology development
- Partnered with drone manufacturers for medical supply chain logistics
- Completed over 1,000 medical sample drone deliveries
Artificial Intelligence and Machine Learning Integration
| AI Investment | Route Optimization Efficiency | Cost Savings |
|---|---|---|
| $75 million in AI technologies | 7-12% route efficiency improvement | Estimated $200 million annual savings |
Expanding Healthcare Logistics and Medical Supply Chain Management
UPS Healthcare segment generated $1.6 billion in revenue in 2022, with projected growth of 15-20% annually.
- Invested $220 million in specialized healthcare logistics infrastructure
- Developed temperature-controlled transportation solutions
- Expanded cold chain logistics capabilities
Potential Investments in Renewable Energy and Carbon-Neutral Delivery Solutions
UPS has committed $1.2 billion towards sustainability initiatives by 2025.
| Sustainability Investment | Carbon Reduction Target | Renewable Energy Goal |
|---|---|---|
| $1.2 billion | 12% emissions reduction by 2025 | 25% renewable energy by 2025 |
Disclaimer
All information, articles, and product details provided on this website are for general informational and educational purposes only. We do not claim any ownership over, nor do we intend to infringe upon, any trademarks, copyrights, logos, brand names, or other intellectual property mentioned or depicted on this site. Such intellectual property remains the property of its respective owners, and any references here are made solely for identification or informational purposes, without implying any affiliation, endorsement, or partnership.
We make no representations or warranties, express or implied, regarding the accuracy, completeness, or suitability of any content or products presented. Nothing on this website should be construed as legal, tax, investment, financial, medical, or other professional advice. In addition, no part of this site—including articles or product references—constitutes a solicitation, recommendation, endorsement, advertisement, or offer to buy or sell any securities, franchises, or other financial instruments, particularly in jurisdictions where such activity would be unlawful.
All content is of a general nature and may not address the specific circumstances of any individual or entity. It is not a substitute for professional advice or services. Any actions you take based on the information provided here are strictly at your own risk. You accept full responsibility for any decisions or outcomes arising from your use of this website and agree to release us from any liability in connection with your use of, or reliance upon, the content or products found herein.