|
Univest Financial Corporation (UVSP): BCG Matrix [Dec-2025 Updated] |
Fully Editable: Tailor To Your Needs In Excel Or Sheets
Professional Design: Trusted, Industry-Standard Templates
Investor-Approved Valuation Models
MAC/PC Compatible, Fully Unlocked
No Expertise Is Needed; Easy To Follow
Univest Financial Corporation (UVSP) Bundle
You're trying to figure out where Univest Financial Corporation should place its next dollar in late 2025, so we mapped their business lines onto the BCG Matrix. Honestly, the picture shows clear winners and losers: Core Commercial Lending is a definite Star, driving $507 million in production and expecting 10% to 12% Net Interest Income growth, while the core Banking Segment remains a solid Cash Cow, banking $32.5 million in Q3 pre-tax income. But, you'll also see Dogs like loan outstandings shrinking by $41.1 million and Question Marks like Wealth Management, which holds $5.7 billion but only generated $2.1 million in Q3 profit. Check out the full breakdown below to see the capital allocation priorities we've identified.
Background of Univest Financial Corporation (UVSP)
You're looking to map out the strategic position of Univest Financial Corporation (UVSP), so let's get the foundation right with what we know about the company as of late 2025. Univest Financial Corporation, headquartered in Souderton, Pennsylvania, is a bank holding company that has been around for a while, with one source noting its establishment in 1876. It operates through its wholly owned subsidiary, Univest Bank and Trust Co., providing a comprehensive suite of financial solutions to individuals, businesses, and municipalities in its chosen markets.
The corporation structures its operations across three main business segments, which is key for any portfolio analysis you're planning. These segments are the Banking segment, which is clearly the core engine; the Wealth Management segment; and the Insurance segment. This diversification helps it manage risk and capture revenue across different financial service lines, though, as we'll see, performance varies between them.
Looking at the most recent hard numbers from the third quarter ending September 30, 2025, Univest Financial Corporation held approximately $8.6 billion in total assets, a nice step up from the $8.20 billion reported at the end of Q3 2024. For the nine-month period of 2025, net income was reported at $57.5 million. The company's net interest margin (NIM) showed improvement, hitting 3.09% in Q1 2025 and reaching 3.2% in Q2 2025, reflecting strong net interest income growth, which management guided to be between 10% and 12% for the full year 2025.
Diving into the segment performance for Q3 2025, the Banking Segment was the clear profitability driver, posting a pre-tax income of $32.5 million, a significant jump from $21.6 million in Q3 2024. The Wealth Management Segment, which oversees about $5.7 billion in assets under management and supervision as of September 30, 2025, saw its pre-tax income at $2.1 million for the quarter, showing slight contraction compared to the prior year's quarter. Meanwhile, the Insurance Segment maintained stability, reporting a pre-tax income of $1.1 million for both Q3 2025 and Q3 2024, though year-to-date figures showed a decline due to higher noninterest expenses.
Strategically, management projected a relatively modest full-year 2025 loan growth of 1% to 3%, acknowledging headwinds from loan payoffs, even as year-to-date commercial loan production was solid. The stock trades at a price-to-earnings ratio of about 10.3x, which is notably lower than the US Banks industry average of 11.2x, suggesting the market currently views its growth prospects conservatively. Finance: draft the market share assumptions for the Banking segment by next Tuesday.
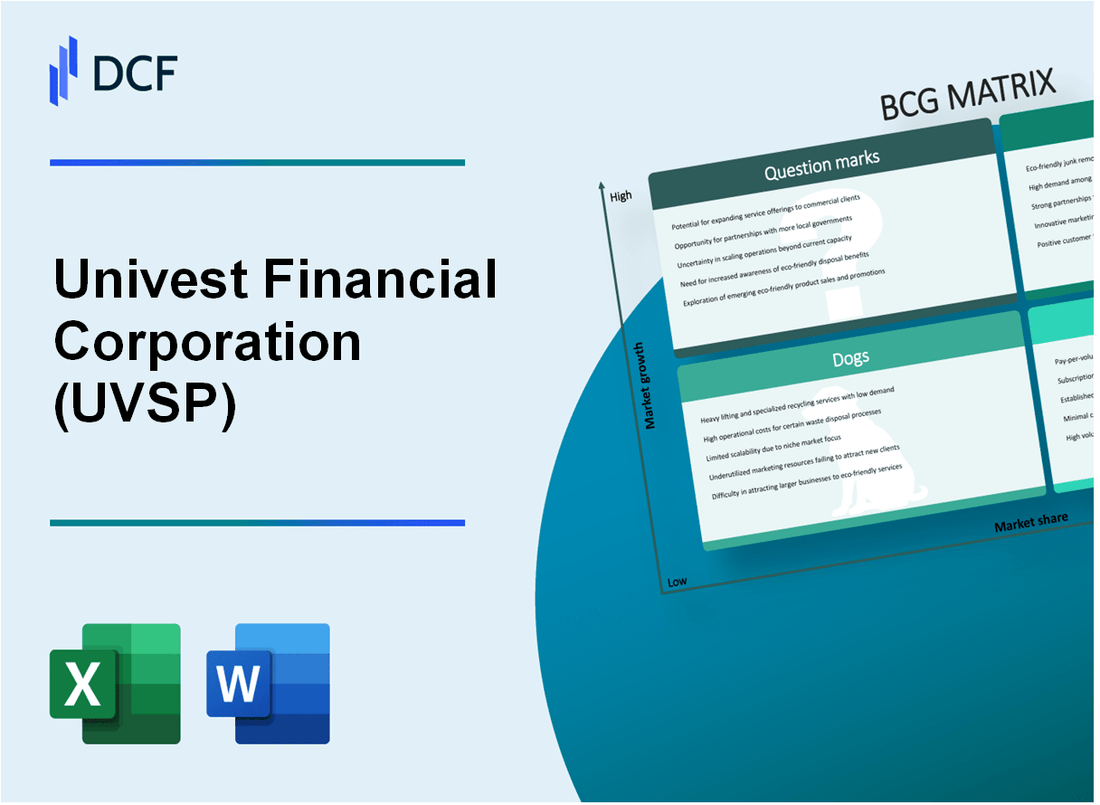
Univest Financial Corporation (UVSP) - BCG Matrix: Stars
You're looking at the business units within Univest Financial Corporation that are leading their respective high-growth areas. These are the engine room activities, demanding significant cash to maintain their leading position but promising future stability as market growth matures.
The Core Commercial Lending Production is definitely a Star performer, showing year-to-date production of $507 million through the second quarter of 2025. This high production volume in a key market segment signifies a strong market share capture, even if loan outstandings contracted by $25.4 million year-to-date due to early payoffs.
The outlook for profitability in this area is strong, with management projecting full-year 2025 Net Interest Income (NII) growth of 10% to 12% compared to 2024. This growth is supported by the third quarter results, where NII reached $61.3 million, a 15.3% increase year-over-year.
Liquidity generation, a key input for funding growth, shows a Star characteristic with strong deposit growth. Total deposits increased by $635.5 million, or 9.7%, from the end of the second quarter to reach $7.2 billion as of September 30, 2025. A significant portion of this was the seasonal build in public funds deposits, amounting to $473.2 million during the quarter.
Fee-based services supporting the core business are also showing momentum. For instance, Treasury Management services, a part of the overall service fee income, contributed to a 13.0% increase in Service charges on deposit accounts for the third quarter of 2025 compared to the prior year.
Here's a quick look at the key metrics supporting the Star categorization for these high-share, high-growth areas:
| Metric | Value/Range | Period/Context |
| Core Commercial Loan Production | $507 million | Year-to-Date through Q2 2025 |
| Projected Full-Year NII Growth | 10% to 12% | For the full year 2025 |
| Total Deposit Growth | 9.7% increase | Q3 2025 over Q2 2025 |
| Q3 2025 Net Interest Income | $61.3 million | Q3 2025 |
| Public Funds Deposit Build | $473.2 million | Q3 2025 |
| Service Charge on Deposit Accounts Growth | 13.0% increase | Q3 2025 vs. prior year |
The high growth in production and NII indicates these segments are leaders in a growing market, but they require continued investment to maintain that edge. The strength in deposits provides the necessary funding base, though the reliance on seasonal public funds needs monitoring. The key is sustaining this success until the market growth naturally slows, allowing these units to transition into Cash Cows.
- Maintain focus on construction commitments, as noted by management.
- Monitor the impact of early payoffs on loan outstanding balances.
- Leverage the strong Treasury Management fee growth to offset any slowdowns elsewhere in fee income.
If onboarding takes 14+ days, churn risk rises, which is a constant consideration when managing high-volume production like this. Finance: draft 13-week cash view by Friday.
Univest Financial Corporation (UVSP) - BCG Matrix: Cash Cows
You're looking at the core engine of Univest Financial Corporation's profitability, the segment that consistently throws off cash to fund the rest of the enterprise. These are the established businesses with high market penetration in mature areas-the definition of a Cash Cow in the BCG framework.
The Banking Segment is the powerhouse here, reporting a pre-tax income of $32.5 million for the third quarter of 2025. This segment's performance is heavily reliant on its core lending and deposit-taking activities, which generate the majority of the corporation's earnings.
The stability of this cash flow is underpinned by the established deposit base in the Mid-Atlantic region. Look at the sheer volume: total deposits reached $7.218 billion as of September 30, 2025. This large, sticky base provides a reliable, low-cost funding source, which is crucial for margin management.
Here's a quick look at the key financial metrics driving this segment's cash generation for Q3 2025:
| Metric | Value (Q3 2025) |
| Banking Segment Pre-Tax Income | $32.5 million |
| Reported Net Interest Margin (NIM) | 3.17% |
| Core Net Interest Margin (NIM) (Excluding Excess Liquidity) | 3.33% |
| Net Interest Income | $61.32 million |
| Total Deposits | $7.218 billion |
The Net Interest Margin (NIM) is the primary driver of revenue for this unit. The reported NIM for the third quarter of 2025 stood at 3.17%. However, when you adjust for the impact of excess liquidity-which temporarily depresses the margin-the core NIM expanded to 3.33%, showing strong underlying pricing power in the lending and funding markets.
This segment's ability to generate excess cash is evident in the corporation's commitment to shareholder returns. Univest Financial Corporation has maintained consistent dividend payments for 47 consecutive years. This long track record signals to you that management prioritizes returning reliable, predictable cash flow to the market, a hallmark of a strong Cash Cow business unit.
The balance sheet also shows significant liquidity supporting operations, which can be 'milked' passively or used for efficiency investments:
- Cash and Cash Equivalents as of September 30, 2025: $816.7 million.
- Uncommitted funding sources from correspondent banks at September 30, 2025: $457.0 million.
You should view these figures as the foundation; they fund the riskier Question Marks and keep the lights on. It's defintely the most stable part of the portfolio.
Univest Financial Corporation (UVSP) - BCG Matrix: Dogs
You're looking at the segments of Univest Financial Corporation (UVSP) that are currently demanding attention because they aren't driving significant growth or market share, fitting the profile of Dogs in the Boston Consulting Group Matrix. These areas often tie up capital without providing much return, so minimizing exposure is key.
Consider the core lending operations, which show a clear slowdown in net growth. Net loan outstandings contracted by $41.1 million year-to-date through the third quarter of 2025 when compared to the growth of $163.5 million seen in the prior year period. This contraction of $41.1 million in loan outstandings from December 31, 2024, suggests that payoffs are outpacing new originations in the current environment. It's a clear signal that this asset base isn't expanding as it used to.
The Mortgage Banking activities are definitely feeling the pinch of the market. Net gain on mortgage banking activities decreased by $448 thousand, which is a 34.6% drop for the quarter ended September 30, 2025, compared to the same period last year. This decline directly reflects the impact of the elevated interest rate environment and increased competition in that specific area of the business.
Lease Financing, which is a smaller component of the overall portfolio, also saw contraction. Gross loans and leases within this segment decreased from the balance at December 31, 2024. This was primarily driven by reductions in commercial and residential mortgage loans, alongside the decrease in lease financings themselves.
Credit quality issues, though isolated, highlight a specific risk area that requires careful management, even if it's not a systemic problem across the entire loan book. Non-accrual loans stemmed from a single credit event recognized in the second quarter of 2025. That relationship had a carrying balance of $16.4 million as of June 30, 2025. By September 30, 2025, the remaining loan balance secured by commercial real estate collateral stood at $13.9 million following a $7.3 million charge-off recognized in the second quarter.
Here's a quick look at the key financial indicators associated with these challenged areas as of Q3 2025:
| Metric | Value/Change | Period/Date |
| Net Loan Outstandings (YTD Change) | Contracted $41.1 million | Through Q3 2025 |
| Prior Year Loan Growth (YTD) | $163.5 million Growth | Prior Year Period |
| Net Gain on Mortgage Banking (Qtr Change) | Decreased $448 thousand | Q3 2025 vs. Q3 2024 |
| Mortgage Banking Decrease Percentage | 34.6% Decrease | Q3 2025 vs. Q3 2024 |
| Non-Accrual Loan Balance (Single Credit) | $16.4 million (Carrying Value) | As of June 30, 2025 |
| Remaining Non-Accrual Loan Balance | $13.9 million | As of September 30, 2025 |
These figures point to specific units or activities that fit the Dog profile: low market share/growth and potential cash traps. You should focus your review on the following aspects:
- Loan outstandings contraction year-to-date.
- Decreased salable volume in mortgage banking.
- Contraction in gross loans for Lease Financing.
- The single credit event impacting non-accruals.
Honestly, when you see loan outstandings shrinking like this, it means the engine isn't firing on all cylinders, even if other parts of Univest Financial Corporation are performing well. The focus here must be on minimizing the capital tied up in these lower-performing areas.
Finance: draft a divestiture analysis for the Lease Financing portfolio by next Wednesday.
Univest Financial Corporation (UVSP) - BCG Matrix: Question Marks
These Question Marks represent business units within Univest Financial Corporation that operate in high-growth areas but currently hold a low relative market share. They are cash-intensive, needing significant investment to capture more market position, but their current returns are low relative to the cash consumed.
Wealth Management is a clear example of this quadrant. As of the end of Q3 2025, this division managed approximately $5.7 billion in assets, according to the scenario outline. However, the pre-tax income generated from this substantial asset base was only $2.1 million for the third quarter of 2025. This low return on a large asset base suggests either high operating costs or insufficient market penetration relative to competitors in the wealth space.
The push for growth in fee-based revenue, specifically investment advisory commission and fee income, shows promise but remains small in the overall revenue picture. While the prompt suggests a solid clip of growth at 8.1% for Q1 2025, concrete figures from Q1 2025 show Trust Fee Income was $2.161 million, up from $2.108 million the prior year. This indicates growth is happening, but the absolute dollar contribution is minor compared to core net interest income.
The Insurance segment is explicitly positioned as a non-core line requiring continued capital infusion to build share. This unit is consuming resources without being a primary driver of profit. For Q3 2025, the Insurance segment contributed a pre-tax income of just $1.1 million, showing it is not yet self-sustaining or highly profitable, necessitating strategic decisions on future investment levels.
The overall strategic direction for noninterest income reflects this uncertainty. Full-year 2025 guidance is set for a modest growth rate of only 1% to 3%, based off a 2024 base of $84.5 million. This conservative guidance signals that management does not foresee an immediate, rapid scaling of these fee-based, non-core activities, which is characteristic of managing Question Marks-the path to becoming a Star is not yet clear or guaranteed.
Here is a snapshot of the key financial indicators aligning these units with the Question Mark profile:
| Business Unit/Metric | Value/Rate | Period/Context |
| Wealth Management Assets Under Management | $5.7 billion | As per scenario outline |
| Wealth Management Pre-tax Income | $2.1 million | Q3 2025 |
| Investment Advisory/Trust Fee Income Growth | 8.1% | Q1 2025 (as per scenario) |
| Trust Fee Income (Actual) | $2.161 million | Q1 2025 |
| Insurance Segment Pre-tax Income | $1.1 million | Q3 2025 |
| FY 2025 Noninterest Income Growth Guidance | 1% to 3% | Full Year 2025 |
| 2024 Noninterest Income Base for Guidance | $84.5 million | 2024 Actual |
The characteristics defining these units as Question Marks include:
- High Growth Markets: Fee-based income and specialized services are generally high-growth areas in finance.
- Low Current Share/Return: Evidenced by the $2.1 million pre-tax income on $5.7 billion in Wealth Management assets.
- Cash Consumption: The Insurance segment requires continued investment to gain traction.
- Uncertain Future: The modest 1% to 3% noninterest income growth guidance suggests a slow, uncertain path to significant scale.
You need to decide where to place capital to drive market share quickly, or if these units should be divested before they turn into Dogs. Finance: draft a sensitivity analysis on the required investment to move Wealth Management pre-tax income to $5 million in Q4 2025 by Friday.
Disclaimer
All information, articles, and product details provided on this website are for general informational and educational purposes only. We do not claim any ownership over, nor do we intend to infringe upon, any trademarks, copyrights, logos, brand names, or other intellectual property mentioned or depicted on this site. Such intellectual property remains the property of its respective owners, and any references here are made solely for identification or informational purposes, without implying any affiliation, endorsement, or partnership.
We make no representations or warranties, express or implied, regarding the accuracy, completeness, or suitability of any content or products presented. Nothing on this website should be construed as legal, tax, investment, financial, medical, or other professional advice. In addition, no part of this site—including articles or product references—constitutes a solicitation, recommendation, endorsement, advertisement, or offer to buy or sell any securities, franchises, or other financial instruments, particularly in jurisdictions where such activity would be unlawful.
All content is of a general nature and may not address the specific circumstances of any individual or entity. It is not a substitute for professional advice or services. Any actions you take based on the information provided here are strictly at your own risk. You accept full responsibility for any decisions or outcomes arising from your use of this website and agree to release us from any liability in connection with your use of, or reliance upon, the content or products found herein.