
|
Wayfair Inc. (W): ANSOFF MATRIX [Dec-2025 Updated] |
Fully Editable: Tailor To Your Needs In Excel Or Sheets
Professional Design: Trusted, Industry-Standard Templates
Investor-Approved Valuation Models
MAC/PC Compatible, Fully Unlocked
No Expertise Is Needed; Easy To Follow
Wayfair Inc. (W) Bundle
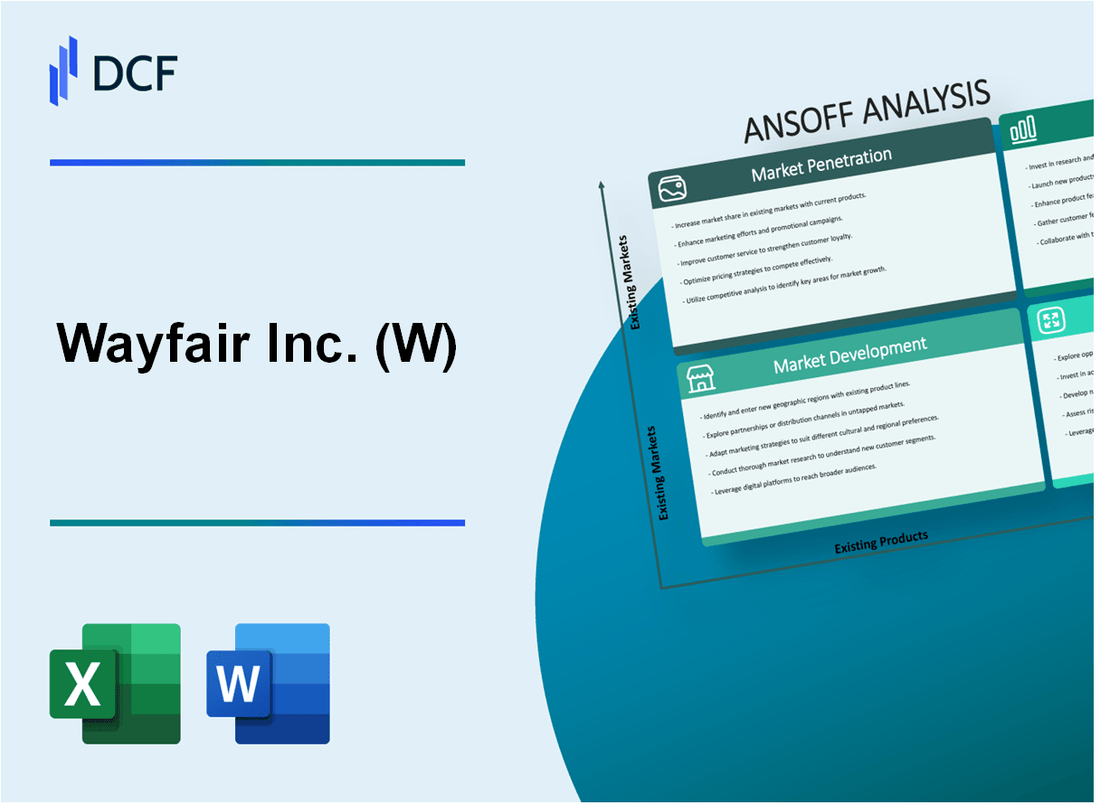
You're looking at Wayfair Inc. right now and seeing a company that's finally moving past the pandemic boom and into a more sustainable, tech-focused future, which I defintely find compelling after two decades in this game. The roadmap for this structural profitability is laid out clearly in its four-part Ansoff strategy, balancing safe bets like driving repeat orders-which already hit 80.1% of Q3 2025 orders-with more aggressive moves. Honestly, the real story isn't just selling more furniture; it's how they plan to turn their proprietary logistics network, CastleGate, into a third-party service, aiming for new, accretive revenue streams outside of just moving their own sofas. Dive below to see the precise actions for Market Penetration, Development, Product Innovation, and that crucial Diversification play.
Wayfair Inc. (W) - Ansoff Matrix: Market Penetration
You're looking at how Wayfair Inc. is digging deeper into its existing home goods market, which is the essence of Market Penetration. It's about getting more from the customers you already have and solidifying your position where you already operate. Here's the quick math on what they've been doing to capture more share in the current landscape.
The focus on existing customers is clearly paying off. Repeat business is the bedrock here, showing customers are coming back for more. In the third quarter of 2025, repeat customers placed 7.9 million orders, which represented 80.1% of all orders delivered that quarter. Overall, total orders delivered grew by 5.4% year-over-year, hitting 9.8 million units in Q3 2025.
| Metric | Q3 2025 Actual / Guidance | Context |
|---|---|---|
| Total Net Revenue | $3.1 billion | Q3 2025 Total Net Revenue |
| U.S. Net Revenue | $2.7 billion | Q3 2025 U.S. Net Revenue |
| Orders Delivered (Total) | 9.8 million | Q3 2025 Orders Delivered, up 5.4% YoY |
| Repeat Orders Percentage | 80.1% | Q3 2025 Repeat Customer Orders Share |
| Adjusted EBITDA Margin | 6.7% | Q3 2025 Non-GAAP Adjusted EBITDA Margin |
| Advertising Spend (Q4 Guidance) | 11%-12% of net revenues | Projected range for Q4 2025 |
Cost discipline is a major theme, especially when trying to maintain a contribution margin above the target of 15%. While the specific contribution margin isn't reported, the focus on operational leverage is evident in the profitability metrics. Wayfair Inc. achieved a Non-GAAP Adjusted EBITDA margin of 6.7% in Q3 2025, which management noted was the highest level outside the pandemic period. This strong flow-through suggests tight control over costs supporting the margin goals.
To keep advertising spend efficient, the company is guiding for advertising expenses to be in the 11% to 12% of net revenues range for the fourth quarter of 2025. This is right in line with the internal target of keeping it near the 12%-13% range, showing a clear effort to manage customer acquisition costs effectively as the business returns to growth.
The Wayfair Rewards loyalty program, launched in 2025 with an annual fee of $29, is designed to boost loyalty and frequency. The program is showing early success, particularly through the Wayfair Verified selection, which acts as a quality signal for shoppers navigating the vast online catalog. The impact of these loyalty efforts includes:
- Wayfair Verified items convert 25% better than non-verified items.
- Wayfair Verified items generate approximately 20% higher Net Promoter Scores.
- The program aims to generate higher repeat purchase behavior compared to non-verified items.
- The program offers benefits like 5% back in rewards and free shipping on all items.
Expanding the physical retail footprint is a key tactic for market penetration, bringing the digital brand to established high-potential markets. This omnichannel approach aims to create a sales halo effect, similar to the one seen in Illinois following the May 2024 Wilmette store opening. You can expect to see the next major physical touchpoints:
- Atlanta, Georgia: Planned opening in 2026.
- Yonkers, New York (New York metro area): Planned opening in early 2027.
The Atlanta location is planned as a 150,000-square-foot large-format store, designed to offer an immersive experience and immediate take-home options, supported by the nearby McDonough, Georgia fulfillment center for fast delivery of larger items.
Finance: draft 13-week cash view by Friday.
Wayfair Inc. (W) - Ansoff Matrix: Market Development
You're looking at how Wayfair Inc. plans to take its existing business model into new markets or use existing markets more deeply. This Market Development quadrant is about geographic expansion and segment focus, like pushing Wayfair Professional harder or using physical stores to reach new high-end buyers.
Aggressively grow the Wayfair Professional (B2B) segment, aiming to lift the trailing twelve months (LTM) net revenue per active customer above the $578 reported as of September 30, 2025. The overall business is showing leverage, with the US segment posting an Adjusted EBITDA margin of 7.8% in Q2 2025.
Scale the luxury-focused Perigold brand with new physical stores to capture high-end customers. The debut Perigold store opened in Houston in June 2025. A second, larger location, spanning 30,000 square feet, is slated for West Palm Beach in the Fall of 2025. This location will showcase products from over 150 luxury home brands. This omnichannel push follows the opening of a full-line store outside Chicago last year, which saw a 50% increase in sales for lower-ticket items like kitchen accessories in that metro area.
Focus on deepening penetration in existing international markets like Canada and the UK, following the German exit. Wayfair Inc. officially exited the German market in January 2025. The company reported that Q2 2025 total net revenue growth would have been 6.0% year-over-year instead of 5.0% if the German exit impact was excluded. International net revenue for Q3 2025 reached $389 million, marking a 4.6% increase year-over-year.
Utilize the CastleGate logistics network to offer faster delivery speeds in underserved US regions. Products shipped from Wayfair's fulfillment centers currently account for 25% of total revenue. The CastleGate Forwarding volume has seen a 40% year-over-year increase. The network has a warehouse capacity of 22 million square feet across 60 buildings. Furthermore, the CastleGate Multichannel offering, which acts as a third-party logistics service, is rapidly scaling with hundreds of suppliers now using it.
Target new customer demographics with tailored brands like AllModern and Joss & Main. While specific 2025 brand performance data isn't broken out for these, the company is seeing success with loyalty programs; repeat customers placed 80.1% of all orders delivered in Q3 2025. The Wayfair app now drives an all-time high of about 30% of US revenue.
Here's a quick look at some key operational and financial metrics from the 2025 reporting periods:
| Metric | Value/Period | Date/Context |
|---|---|---|
| Total Net Revenue | $3.1 billion | Q3 2025 |
| US Net Revenue | $2.7 billion | Q3 2025 |
| International Net Revenue | $389 million | Q3 2025 |
| Gross Margin | 30.0% | Q3 2025 |
| Non-GAAP Adjusted EBITDA | $208 million | Q3 2025 |
| LTM Net Revenue Per Active Customer | $578 | As of Q3 2025 |
| CastleGate Fulfillment Revenue Share | 25% | As of 2025 |
| CastleGate Forwarding Volume Growth | 40% | Year-over-year |
The company is also focusing on quality signals, as the Wayfair Verified program is driving 25% better conversion rates and 20% higher Net Promoter Scores.
- Wayfair Rewards program is gaining traction on member growth.
- App revenue hit an all-time high, representing about 30% of US revenue.
- New stores are planned for Atlanta, New York, and Denver in 2026 and 2027.
- The company targets a contribution margin of 15% or higher.
Wayfair Inc. (W) - Ansoff Matrix: Product Development
You're looking at how Wayfair Inc. is innovating its product offering to capture more customer spend, which is the essence of Product Development in the Ansoff Matrix. This isn't just about adding SKUs; it's about using technology and quality signals to drive higher conversion and average order value.
Wayfair Inc. is pushing new AI-driven tools, like visual search, to make product discovery frictionless, especially heading into the 2025 holiday season. This builds on prior success; for instance, their 'View in Room' augmented reality (AR) feature previously demonstrated a 92% higher conversion rate. The company is embedding these technologies across the platform, with CEO Niraj Shah highlighting the 'Search with Photo' feature, which lets you upload an image to find visually similar products. This focus on digital experience is clearly paying off, as Wayfair Inc. reported a 5.0% year-over-year total net revenue increase in Q2 2025, reaching $3.3 billion.
The strategy involves expanding categories where technology integration is key, such as housewares and home improvement, as the broader smart home market is a significant growth area. The global smart home market size is estimated at $162.27 billion in 2025, driven by interest in connected living and home appliances. While I don't have Wayfair Inc.'s internal growth rate for that specific segment, the market trend supports expanding product lines that incorporate smart technology.
To address quality concerns in the 'endless aisle,' Wayfair Inc. is curating the Wayfair Verified program. This program highlights items that have passed a rigorous evaluation process. The financial impact is tangible: items carrying the verified checkmark are converting over 25% better than items without it. Furthermore, these verified items achieve approximately 20% higher net promoter scores. The company plans to scale this, aiming for an initial 50,000 Verified items by year-end.
A critical financial lever in this product strategy is the supplier advertising business. Wayfair Inc. ended 2024 with this business exceeding 150 basis points of revenue. The roadmap clearly targets increasing this penetration toward a 300 to 400 basis points goal. This means more suppliers are paying for premium placement alongside their products, which directly supports profitability goals; for example, Non-GAAP Adjusted EBITDA for Q3 2025 was $208 million.
Responding to 2025 consumer trends, Wayfair Inc. is launching new product lines focused on sustainability and space optimization. Wayfair Professional's 2025 Design Trends explicitly featured 'Restorative Realms,' which blends sustainable design with a serene aesthetic. This aligns with the broader market expectation for eco-conscious purchasing. You can see the operational results of these focused efforts in the repeat customer behavior; in Q2 2025, repeat customers placed 80.7% of total orders.
Here's a quick look at how some of these product and technology initiatives tie into recent financial performance:
| Metric | Value/Rate | Period/Context |
| Total Net Revenue | $3.3 billion | Q2 2025 |
| U.S. Net Revenue Growth | 5.3% | Q2 2025 vs. prior year |
| Wayfair Verified Conversion Lift | 25% better | Compared to non-verified items |
| Supplier Ad Penetration (End of 2024) | Over 150 basis points | Of revenue |
| Supplier Ad Penetration Goal | 300-400 basis points | Roadmap Target |
| Repeat Customer Order Share | 80.7% | Q2 2025 |
The focus on product quality and digital visualization is clearly designed to increase customer lifetime value, which is reflected in the LTM net revenue per active customer growing to $572 as of June 30, 2025.
The key product development actions you should track are:
- Adoption rate of new AI visualization tools for the holiday season.
- Growth in the number of Wayfair Verified items beyond the initial 50,000 target.
- Contribution margin improvement driven by higher-margin Verified items.
- Supplier advertising penetration reaching the 300 basis points mark.
- Sales velocity in new sustainable and space-saving collections.
Finance: draft the Q4 2025 revenue forecast sensitivity analysis based on a 350 basis point supplier ad penetration by end of year.
Wayfair Inc. (W) - Ansoff Matrix: Diversification
You're looking at Wayfair Inc.'s move to monetize its massive investment in logistics, turning a competitive moat into a separate, accretive business line. This is the Diversification quadrant in action: selling your existing, specialized capability-handling big and bulky goods logistics-to new customers.
The core of this diversification is the expansion of CastleGate into a multi-channel Third-Party Logistics (3PL) service. This means suppliers can now use Wayfair Inc.'s network to fulfill orders for their entire customer base, not just orders placed on Wayfair's sites. This new offering is rapidly scaling, with hundreds of suppliers already utilizing the service as of the August 2025 earnings call. This leverages the existing infrastructure built over years to solve the complex problem of shipping large, heavy home goods.
The existing logistics services are showing strong adoption. For instance, the CastleGate Forwarding volume, which helps suppliers with ocean freight, saw a 40% year-over-year increase over the last year. Furthermore, the CastleGate Fulfillment penetration-where Wayfair Inc. stores and ships the inventory-increased by 400 basis points year-over-year as of the second quarter of 2025, meaning it now covers about 25% of Wayfair Inc.'s total revenue. The forwarding service has also been extended geographically, unlocking new supplier networks by expanding into markets like Brazil and India.
Here's a quick look at the scale and growth within the logistics ecosystem as of the latest reported periods in 2025:
| Metric | Value/Rate | Context/Date |
|---|---|---|
| LTM Net Revenue | $12.241B | Twelve months ending September 30, 2025 |
| Q3 2025 Net Revenue | $3.1B | Up 8.1% Year-over-Year |
| Q3 2025 Adjusted EBITDA | $208M | Up 74.8% Year-over-Year |
| CastleGate Forwarding Volume Growth | 40% | Year-over-Year increase |
| CastleGate Fulfillment Penetration | 25% | Of total revenue as of Q2 2025 |
| CastleGate Fulfillment Penetration Growth | 400 basis points | Year-over-year increase as of Q2 2025 |
The strategy for expanding this 3PL offering involves several key vectors beyond simply opening the doors to more suppliers. You need to think about the technology stack and the final mile, which are critical for a successful external logistics service.
- Expand CastleGate ocean forwarding and fulfillment to external suppliers for a new, accretive revenue stream.
- Invest in operational and technology efforts over the past 18 months to evolve the offering into a comprehensive 3PL service tailored for the home category.
- Explore strategic Mergers and Acquisitions (M&A) specifically in last-mile delivery technology to bolster the new 3PL offering.
- Develop a high-margin, white-label logistics software service derived from the proprietary CastleGate platform.
- Target commercial real estate developers with a full-service furniture and logistics package that goes beyond the current scope of Wayfair Professional.
The success in the core business is providing the fuel for this diversification. For example, Wayfair Inc.'s U.S. segment revenue in the third quarter of 2025 grew 8.6% year-over-year to $2.7 billion. This strong domestic performance, coupled with disciplined spending, supports the capital allocation needed for these new ventures. If onboarding takes 14+ days for external suppliers, churn risk rises, so technology integration speed is defintely key here.
Disclaimer
All information, articles, and product details provided on this website are for general informational and educational purposes only. We do not claim any ownership over, nor do we intend to infringe upon, any trademarks, copyrights, logos, brand names, or other intellectual property mentioned or depicted on this site. Such intellectual property remains the property of its respective owners, and any references here are made solely for identification or informational purposes, without implying any affiliation, endorsement, or partnership.
We make no representations or warranties, express or implied, regarding the accuracy, completeness, or suitability of any content or products presented. Nothing on this website should be construed as legal, tax, investment, financial, medical, or other professional advice. In addition, no part of this site—including articles or product references—constitutes a solicitation, recommendation, endorsement, advertisement, or offer to buy or sell any securities, franchises, or other financial instruments, particularly in jurisdictions where such activity would be unlawful.
All content is of a general nature and may not address the specific circumstances of any individual or entity. It is not a substitute for professional advice or services. Any actions you take based on the information provided here are strictly at your own risk. You accept full responsibility for any decisions or outcomes arising from your use of this website and agree to release us from any liability in connection with your use of, or reliance upon, the content or products found herein.