
|
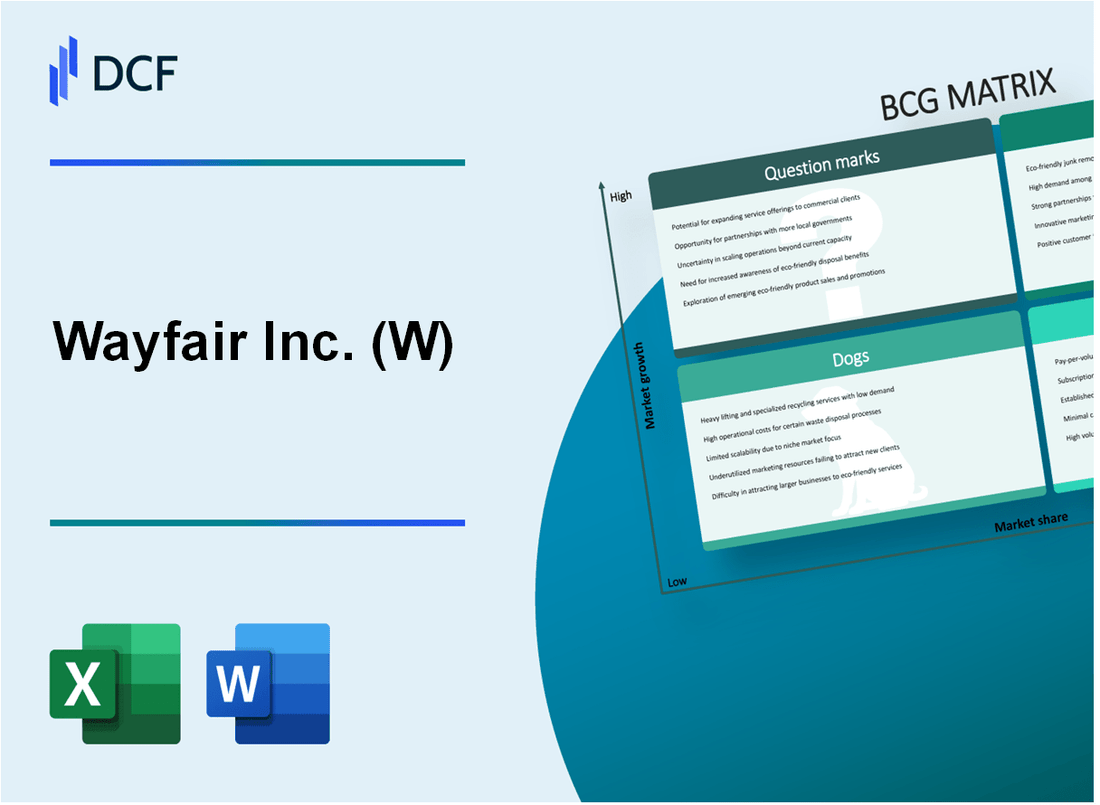
Wayfair Inc. (W): BCG Matrix [Dec-2025 Updated] |
Fully Editable: Tailor To Your Needs In Excel Or Sheets
Professional Design: Trusted, Industry-Standard Templates
Investor-Approved Valuation Models
MAC/PC Compatible, Fully Unlocked
No Expertise Is Needed; Easy To Follow
Wayfair Inc. (W) Bundle
You're looking for a clear-eyed view of Wayfair Inc.'s portfolio, and the BCG Matrix is the perfect tool to map their current strategic bets against the backdrop of a volatile home goods market. We've mapped their business units: the high-growth Stars like Wayfair Professional and AI integration are fueling the stable Cash Cows-the core US platform generating $2.7$ billion in Q3 2025 revenue with 80.1% repeat orders, backed by $93$ million in Q3 2025 Free Cash Flow. Still, you need to watch the Dogs, like the shrinking 21.2$ million active customer base, and the big Question Marks, such as the capital-intensive physical retail gamble. Dive in to see exactly where Wayfair Inc. is placing its bets for the next phase of growth, from the 15.8% margin on CastleGate to the low 4.6% YoY growth in some international areas.
Background of Wayfair Inc. (W)
Wayfair Inc. is the online destination for home goods, operating globally but headquartered right there in Boston, Massachusetts. You know them for their massive online selection, which spans furniture, décor, housewares, and home improvement products across several branded websites like Wayfair.com, AllModern, and Perigold. They don't manufacture much themselves; instead, they offer placement to over 11,000 suppliers, showcasing more than 14 million items on their platform. This model has positioned them as a major player in the e-commerce space for home furnishings.
Looking at the most recent numbers we have, the third quarter of 2025 showed a definite return to growth momentum. For the quarter ending September 30, 2025, Wayfair Inc. posted total net revenue of $3.1 billion, which was up 8.1% year-over-year. If you factor out the impact from their exit from the German market, that growth rate actually accelerated to 9.0% year-over-year. The U.S. segment was the engine, bringing in $2.7 billion, while International revenue was $389 million for the period.
To be fair, the bottom line still showed a net loss, coming in at $99 million for Q3 2025. However, the operational leverage is clearly improving, which is what management is focused on right now. Non-GAAP Adjusted EBITDA hit $208 million, resulting in a margin of 6.7%, which the company noted was the highest level achieved outside of the pandemic period. Gross profit for the quarter was $934 million, representing a gross margin of 30.0% of total net revenue.
You'll notice a trend in the customer metrics: active customers are shrinking while spending per customer is rising. As of September 30, 2025, active customers totaled 21.2 million, a decrease from prior periods. Still, the last twelve months net revenue per active customer grew to $578. This suggests that while acquiring new, consistent buyers is a challenge, the existing base is spending more per transaction or more frequently over the year. The company generated $12.2 billion in net revenue for the twelve months leading up to that date.
Strategically, Wayfair Inc. continues to evolve its footprint. They are actively experimenting with physical retail, having opened their third large-format store in 2025, with plans for more. This is happening while they continue to refine their logistics network, which includes CastleGate and the Wayfair Delivery Network (WDN). Analysts tracking the broader specialty home product retail space suggested that Wayfair's market share was 'broadly flat' around the second quarter of 2025, even as they push these new growth and efficiency initiatives.
Wayfair Inc. (W) - BCG Matrix: Stars
The business units or products with the best market share and generating the most cash are considered Stars. Monopolies and first-to-market products are frequently termed Stars too. However, because of their high growth rate, Stars consume large amounts of cash. This generally results in the same amount of money coming in that is going out. Stars can eventually become Cash Cows if they sustain their success until a time when a high-growth market slows down. A key tenet of a Boston Consulting Group (BCG) strategy for growth is to invest in Stars'
Wayfair Professional (B2B) segment, a high-value focus area driving higher Average Order Value (AOV).
The overall US market, which encompasses the B2B segment, demonstrated significant top-line acceleration in the third quarter of fiscal year 2025. The US net revenue for the third quarter ended September 30, 2025, was $2.7 billion, representing an increase of 8.6% year-over-year. For the twelve months ended June 30, 2025, the Last Twelve Months (LTM) net revenue per active customer was $572, an increase of 5.9% year-over-year. As of September 30, 2025, the LTM net revenue per active customer rose to $578, up 6.1% year-over-year.
Perigold, the luxury home brand, which is gaining share in a premium niche with high-margin potential.
The brand continues to be a focus area for expansion, including physical retail presence. Perigold announced a second confirmed brick-and-mortar storefront for Spring 2025 in Houston.
Generative AI/Tech Integration (e.g., Muse), a high-investment initiative expected to drive conversion and efficiency.
The integration of AI is showing measurable impact on customer engagement. In August 2025, Large Language Models (LLMs) like ChatGPT and Perplexity generated more than 500,000 visits to Wayfair.com in the United States. This compares to a ratio of just 1% of referral traffic from LLMs in August 2024. The Wayfair app's Discover tab now incorporates learnings from its Muse AI generation tool, which generates shoppable images of rooms, and the updated tab boosted visit duration and conversions.
US Market Share Gains, which are accelerating in a flat category, showing high relative growth against competitors.
Wayfair Inc. reported that total net revenue growth, excluding the impact of exiting the German market, was 9.0% year-over-year in the third quarter of 2025. New orders have grown in the mid-single digits for two consecutive periods as of the third quarter of 2025. The company's orders delivered increased by more than 5.4% year-over-year in the third quarter of 2025.
Here are the key financial metrics supporting the high-growth classification for the US business in the first half of 2025:
| Metric | Q1 2025 Value | Q2 2025 Value | Q3 2025 Value |
|---|---|---|---|
| US Net Revenue ($ billions) | $2.4 | $2.9 | $2.7 |
| US Net Revenue YoY Growth (%) | 1.6% | 5.3% | 8.6% |
| Total Net Revenue YoY Growth (Ex-Germany) (%) | N/A (Total was flat YoY) | 6.0% | 9.0% |
| LTM Net Revenue per Active Customer ($) | $562 | $572 | $578 |
| Orders Delivered YoY Growth (%) | N/A (9.1 million total orders) | 0.0% (10.0 million orders) | 5.4% (9.8 million orders) |
The focus on technology and customer experience is driving this performance, as evidenced by the following operational highlights:
- LTM net revenue per active customer increased by 6.1% as of September 30, 2025.
- Repeat customers placed 80.1% of total orders delivered in the third quarter of 2025.
- Non-GAAP Adjusted EBITDA for Q3 2025 was $208 million.
- Non-GAAP Adjusted Diluted Earnings Per Share for Q3 2025 was $0.70.
- Net cash provided by operating activities for Q3 2025 was $155 million.
Wayfair Inc. (W) - BCG Matrix: Cash Cows
You're looking at the engine room of Wayfair Inc.'s operations, the segment that generates the consistent, reliable cash flow needed to fund riskier bets. These are the established businesses with a commanding share in mature markets. For Wayfair Inc., the core U.S. e-commerce platform definitely fits this profile.
The foundation here is the domestic market. The core U.S. E-commerce Platform generated $2.7 billion in revenue for the third quarter of 2025. That's a significant, high-share base in a market that, while still growing, is past its hyper-growth phase. This steady performance is what allows the company to invest elsewhere without constant pressure on its balance sheet.
Stability comes from customer loyalty, which is a hallmark of a good Cash Cow. The Repeat Customer Base is providing that bedrock revenue stream. In Q3 2025, repeat customers placed 80.1% of all total orders delivered. That high percentage shows you the stickiness of the platform; these aren't just one-time buyers, they're coming back for more home goods.
We can see the efficiency gains flowing directly to the bottom line through proprietary assets. The CastleGate Logistics Network, a key part of their supply chain strategy, is driving a high contribution margin of 15.8% as of Q3 2025. That margin is a direct result of disciplined operational execution, which is exactly what you want from a Cash Cow-it consumes less to support itself while yielding high returns.
All this operational strength translates directly into cash generation. Wayfair Inc. posted an overall positive Free Cash Flow (FCF) of $93 million in Q3 2025. This positive FCF is the lifeblood, funding other segments, paying down debt, or supporting infrastructure upgrades. Honestly, seeing that positive FCF number, especially when paired with that high contribution margin, tells you the core business is working exactly as it should.
Here are the key financial metrics underpinning this Cash Cow segment's performance for the third quarter of 2025:
| Metric | Value (Q3 2025) |
|---|---|
| U.S. Net Revenue | $2.7 billion |
| Repeat Customer Order Share | 80.1% |
| CastleGate Contribution Margin | 15.8% |
| Non-GAAP Free Cash Flow (FCF) | $93 million |
Because this segment is mature, the focus shifts from massive promotion to efficiency. You don't need to spend heavily to convince people to buy from a market leader; you need to make the process cheaper and smoother. Investments into supporting infrastructure, like further optimizing CastleGate, are what improve efficiency and increase that cash flow even more. You're looking to 'milk' these gains passively, defintely.
- Core U.S. E-commerce Platform Revenue: $2.7 billion in Q3 2025.
- Revenue Stability from Repeat Orders: 80.1% of total orders delivered in Q3 2025.
- Profitability Driver: CastleGate Logistics Network achieved a 15.8% contribution margin.
- Cash Generation: Generated $93 million in Non-GAAP Free Cash Flow in Q3 2025.
Finance: draft 13-week cash view by Friday.
Wayfair Inc. (W) - BCG Matrix: Dogs
Dogs, are units or products with a low market share and low growth rates. They frequently break even, neither earning nor consuming much cash. Dogs are generally considered cash traps because businesses have money tied up in them, even though they bring back almost nothing in return. These business units are prime candidates for divestiture.
Dogs are in low growth markets and have low market share. Dogs should be avoided and minimized. Expensive turn-around plans usually do not help.
The components categorized as Dogs for Wayfair Inc. (W) as of the third quarter of 2025 reflect areas of low relative market share and sluggish growth, necessitating strategic pruning or divestiture.
The International Segment (excluding UK/Canada) Performance
The international operations, specifically excluding the UK and Canada, demonstrate characteristics aligning with the Dog quadrant, showing significantly lower growth compared to the core U.S. business. For the third quarter of 2025, this segment generated net revenue of $389 million, representing 12.5% of total net revenues. The year-over-year growth for this specific international grouping was only 4.6%. When measured in constant currency, the growth was even lower at 3.5%. This slower growth profile suggests limited market penetration or high competitive pressure in these specific geographies.
The table below contrasts the performance metrics of the primary geographical segments for Q3 2025:
| Metric | U.S. Segment | International Segment (Excl. UK/Canada) |
| Net Revenue (Q3 2025) | $2.7 billion | $389 million |
| YoY Net Revenue Growth (Q3 2025) | 8.6% | 4.6% |
| Share of Total Net Revenue (Q3 2025) | 87.5% | 12.5% |
Divestiture of German Market Operations
The decision to exit the German market in early 2025 is a definitive action aligning with the strategy to divest non-performing assets. Wayfair Inc. cited the long and costly endeavor required to achieve market-leading growth in Germany, which was lagging the potential return seen in other areas. The company incurred aggregate charges ranging from $102 million to $111 million to execute this exit. This move allowed the company to report total net revenue growth of 8.1% year-over-year in Q3 2025, which accelerated to 9.0% when excluding the impact of the German market exit. The cost savings from this divestiture are expected to be reinvested into remaining international markets like the U.K., Ireland, and Canada, and core initiatives.
Declining Active Customer Base
A shrinking customer base in the overall business points to a low-share issue within the existing market, even if the remaining customers are spending more. As of September 30, 2025, Wayfair Inc. reported active customers totaled 21.2 million. This figure represents a year-over-year decrease of 2.3%. This decline in the number of unique purchasers suggests that certain product lines or marketing efforts are failing to attract or retain a broad customer base, fitting the low-market-share characteristic of Dogs.
The key metrics surrounding the customer base in Q3 2025 are:
- Active customers: 21.2 million
- Year-over-year change in active customers: -2.3%
- LTM net revenue per active customer: $578
- Orders per customer (LTM): 1.87
Legacy, Low-Margin Product Categories
Legacy, low-margin product categories are those that require heavy promotional spend to move inventory, effectively consuming cash or generating minimal returns relative to the capital tied up. While specific category-level margin data isn't explicitly detailed as a 'Dog' category, the overall gross margin for Wayfair Inc. in Q3 2025 was 30.0% of total net revenue, which narrowed 30 basis points year-over-year. This suggests pressure on product margins, potentially from older or less desirable inventory needing markdowns. Advertising expenses for the quarter were $330 million. The company's stated forecast for advertising was in the 11% to 12% of net revenue range. Heavy promotional activity to clear slow-moving stock would directly impact the contribution margin of these legacy items.
These categories are candidates for divestiture or severe reduction because:
- They contribute to margin compression.
- They necessitate high advertising spend to maintain sales velocity.
- They tie up working capital in inventory.
Wayfair Inc. (W) - BCG Matrix: Question Marks
QUESTION MARKS (high growth products (brands), low market share): These segments of Wayfair Inc. are characterized by operating in markets that are growing or represent a high-growth strategic priority, yet the company maintains a relatively low market share within them, thus consuming significant cash for investment.
Physical Retail Stores, a new, high-capital-expenditure strategy with unproven long-term profitability.
Wayfair Inc. operates 12 stores across five banners, signaling a shift from its purely online origins to an omnichannel approach, which is a high-capital-expenditure strategy. The first large-format store opened in Wilmette, Illinois, in May 2024. The momentum from physical retail was noted in the second quarter of 2025. Wayfair Inc. has plans to open three additional large-format stores in the next two years: Atlanta, Georgia in early 2026, Denver, Colorado in late 2026, and Yonkers, New York in 2027. The company is also piloting a smaller-format store concept in Columbus, Ohio, slated for late 2026. While this strategy is generating momentum, its long-term profitability remains unproven, fitting the Question Mark profile of requiring heavy investment to gain share in a segment where physical touchpoints are strategically important for big-ticket items.
International Expansion in focused markets (UK and Canada), which is low share but a high-growth priority post-Germany exit.
Following the exit from the German market, international operations are a focus area, though Q1 2025 showed a contraction. Wayfair Inc.'s International net revenue for the third quarter of 2025 was $389 million, representing a 4.6% year-over-year increase, with International Net Revenue Constant Currency Growth at 3.5%. This contrasts with the U.S. net revenue of $2.7 billion in the same period. The strategic priority is to grow share in these remaining international markets, such as the UK and Canada, which are considered high-growth priorities relative to the exited Germany market. The overall International segment's contribution to total net revenue of $3.1 billion (Q3 2025) remains low, indicating low market share that requires investment to elevate.
New Customer Acquisition, which is a high-cost, low-share area given the active customer count decline.
The effort to bring in new buyers is a cash-consuming activity, evidenced by commentary noting Wayfair Inc.'s elevated advertising spending relative to peers and customer acquisition costs. This investment is aimed at reversing the trend in the active customer base. As of September 30, 2025, Wayfair Inc. had 21.2 million Active Customers, a decrease of 2.3% year-over-year. However, the focus on new customers is showing some traction, as new orders grew at mid-single digits for two consecutive quarters through Q3 2025. The goal is to quickly convert this investment into market share, as the LTM net revenue per active customer rose to $578 as of September 30, 2025, suggesting existing customers are spending more, but new customer growth is needed to avoid becoming a Dog.
Wayfair Rewards loyalty program, a new investment to boost retention, with high initial cost and uncertain long-term ROI.
The Wayfair Rewards loyalty program is a clear investment designed to boost retention and frequency, which are key to improving customer economics. The program costs members $29 annually and offers 5% back in rewards on all merchandise across Wayfair Inc. and its specialty brands. A major benefit requiring upfront cost absorption is free shipping on all items, regardless of order size. This program is currently only available to U.S. customers. The financial implications to watch include the impact on gross margins from rewards and free shipping, and the change in Customer Acquisition Cost (CAC) versus Lifetime Value (LTV). The success hinges on adoption rates offsetting the initial investment and uncertain long-term Return on Investment (ROI).
Here's a quick look at the key 2025 financial and operational metrics relevant to these Question Mark areas:
| Metric | Value / Period | Date / Context |
|---|---|---|
| Total Net Revenue | $3.1 billion | Q3 2025 |
| International Net Revenue | $389 million | Q3 2025 |
| Active Customers | 21.2 million | As of September 30, 2025 |
| Active Customer Change | -2.3% | Year-over-year (Q3 2025) |
| New Orders Growth | mid-single digits | Two consecutive quarters through Q3 2025 |
| Wayfair Rewards Annual Fee | $29 | Program Cost |
| Wayfair Rewards Earning Rate | 5% back | On merchandise purchases |
| Total Liquidity | $1.7 billion | As of September 30, 2025 |
| Physical Stores Operated | 12 | Across five banners |
Disclaimer
All information, articles, and product details provided on this website are for general informational and educational purposes only. We do not claim any ownership over, nor do we intend to infringe upon, any trademarks, copyrights, logos, brand names, or other intellectual property mentioned or depicted on this site. Such intellectual property remains the property of its respective owners, and any references here are made solely for identification or informational purposes, without implying any affiliation, endorsement, or partnership.
We make no representations or warranties, express or implied, regarding the accuracy, completeness, or suitability of any content or products presented. Nothing on this website should be construed as legal, tax, investment, financial, medical, or other professional advice. In addition, no part of this site—including articles or product references—constitutes a solicitation, recommendation, endorsement, advertisement, or offer to buy or sell any securities, franchises, or other financial instruments, particularly in jurisdictions where such activity would be unlawful.
All content is of a general nature and may not address the specific circumstances of any individual or entity. It is not a substitute for professional advice or services. Any actions you take based on the information provided here are strictly at your own risk. You accept full responsibility for any decisions or outcomes arising from your use of this website and agree to release us from any liability in connection with your use of, or reliance upon, the content or products found herein.